
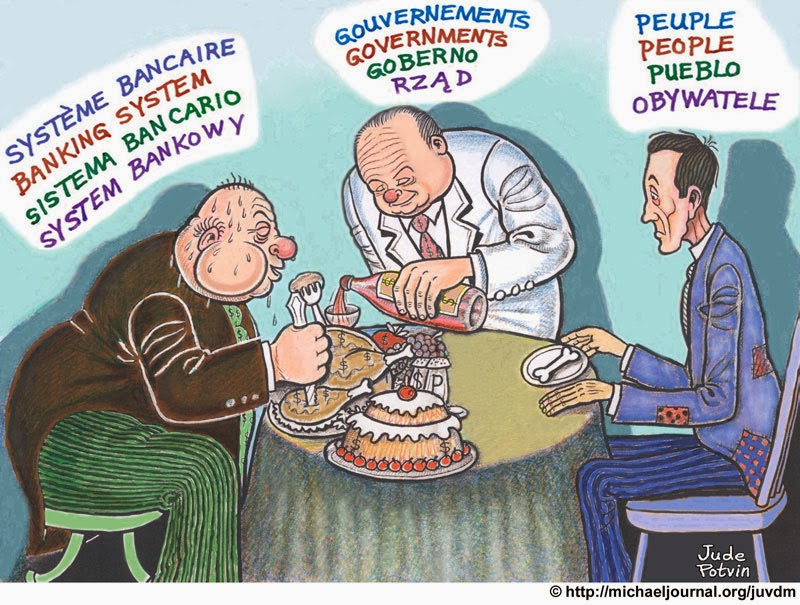
The love of money is the root of all evil.

The Vatican and IOR, see the report below, are not following the encyclical Vix pervenit.
Roma locuta, causa finita… Rome has spoken, the cause is closed… Any rate of interest kills millions of human beings…
Explanations:
https://vimeo.com/136794177
http://www.papalencyclicals.net/Ben14/b14vixpe.htm
https://en.wikipedia.org/wiki/Vix_pervenit
http://www.ior.va/content/dam/ior/documenti/rapporto-annuale/IOR-Annual%20Report%202016.pdf


Invitations 2017
In English
23, Av. Edouard Dapples, CH 1006 LAUSANNE. SUISSE
Tél: international ++ 41 21 616 88 8
http://desiebenthal.blogspot.ch/2015/12/swiss-positive-money-social-credit.html
François de Siebenthal: The love of money is the root of all evil.
3 mai 2009 – Jesus said that the love of money is the root of all evil. This had no meaning for me (although I thought it did) until I read and studied the Social …
François de Siebenthal: Money creation management by the Swiss …
9 oct. 2013 – At least, the SNB controls and limits the money creation and the profits are … Be praised, my Lord, through those who forgive for love of you; …
François de Siebenthal: Games to explain money sytems
25 déc. 2016 – You know that money is created in the form of debts with interest ….. It is really a way to avoid this love of money which is the root of all evils.
The love of money is the root of all evil.Social credit is a solution …
7 févr. 2017 – François de Siebenthal: Games to explain money sytems … 2016 – It is the love of money that is the root of all evil, and with this system, there is …
François de Siebenthal: Federal Council adopts monetary policy report
23 déc. 2016 – He recently spoke to Francois de Siebenthal, who is a former banker from ….. Helicopter Money: Or How I Stopped Worrying and Love …
|
||||
|
ANNUAL
REPORT 2016
Istituto per le Opere di Religione
Cortile Sisto V
00120 Vatican City State
Vatican City State
Registered under No 1 in the Register of Legal Persons
held at “Governatorato” of Vatican City State
Authorization n. 1 of 10/07/2015 issued by AIF,
to carrying out on a professional basis financial activities at Vatican City State
digital copy on site www.ior.va
“Money must serve,
not rule.”
His Holiness Pope Francis, Evangelii Gaudium, 2013
5
TABLE OF CONTENTS
PRESIDENT OF THE COMMISSION OF CARDINALS’ MESSAGE 7
PRELATE’S MESSAGE 8
MANAGEMENT REPORT 9
CHAPTER 1. STRATEGIC INFORMATION 11
1. President of the Board of Superintendence’s Message 11
2. Mission, Customers and Services 13
3. Corporate Governance 14
4. IOR Organization Chart 21
5. Regulatory Framework and Tax Requirements 21
6. Proposal of Distribution of the Net Profit For the Year 26
CHAPTER 2. OPERATIONAL INFORMATION 27
1. 2016 Business Review 27
2. Forecast for 2017 28
FINANCIAL STATEMENTS 31
Balance Sheet 33
Income Statement 34
Statement of Comprehensive Income 35
Statement of Changes in Equity 35
Cash Flow Statement 36
Explanatory Notes 38
Part 1. Accounting Policies 38
Part 2. Information on the Balance Sheet 61
Part 3. Information on Income Statement 82
Part 4. Information on Comprehensive Income 92
Part 5. Information on Risks and Hedging Policies 95
Part 6. Information Concerning Equity 119
Part 7. Related Party Transactions 123
REPORT OF THE REVISORI 125
REPORT OF THE EXTERNAL AUDITORS 131
The present Annual Report has been translated from the original one which is prepared in Italian
IOR
Annual report 2016
7
PRESIDENT OF THE COMMISSION OF CARDINALS’ MESSAGE
The presentation of an annual report provides a convenient opportunity to do a double internal
examination. The first one relates to the last year and the second one refers to the current year, or
better, the future years.
It seems to me that this rule can be applied to the presentation of the IOR annul report for the year
2016. In it, like every human work, one can find anxieties of great success, overcoming complex
or inherited situations, To offer a service appropriate for everyone’s mission, personal contribution
to a cause that is worth serving for professional reasons or for high ethical, religious or humanitarian
inspiration. I think this can be behind the figures presented in the IOR 2016 annul report.
But along with the best dispositions and personal efforts, there is also the stubborn realities of global
economic and financial performance and the recurrent volatility phenomena that often complicate
predictions and expectations.
In this complex context, during the year 2016, the effort of all the members of the large family of
IOR, ecclesiastical or laity servants, each in its place of responsibility at the various levels, took place.
But they come together to serve a global cause with that ethical and exemplary sense that the Holy
Father rightly claims from us all and from each of us. This is His first directive and first requirement,
and not efficiency at any cost.
In this line, as President of the Commission of Cardinals, I feel the duty to express the most heartfelt
thanks to the Cardinals, the Prelate, the Board Members, the Directorate, the Revisori and the
whole staff of our Institute. Allow me to remind all of us that the Holy Father, as he has clearly indicated
on several occasions, requires competent and effective collaborators, but always guided by
inalienable ethical principles, both inside and outside, as servants of the Church. It is our duty to
continue to improve our services in the years to come.
IOR
Annual report 2016
Cardinal Santos Abril y Castelló
President of the Commission of Cardinals
Istituto per le Opere di Religione
8
PRELATE’S MESSAGE
I wish to add my own to the authoritative voices of the Cardinal President of the Commission of
Cardinals’, the President of the Institute and the Director General simply to express my thanks to
all those who, through their commitment and work, have over the past year contributed to renewing
the way the Institute operates. Thanks to them, one step at a time, the IOR has increasingly
been becoming an entity that serves the Church straightforwardly and in a humble way, aware of
its importance in connection with supporting the Holy See’s and Catholic religious organisations’
practical activities, and developing a conscience whereby the Institute is no longer viewed almost
as a separate and independent entity but rather as one that takes as the reason for its very existence
its subordination to projects targeted only to the real needs of Catholics works and not to making
money for the sole purpose of making money. If thanks to management centred on Catholic social
ethics there is money, that is positive, and if for whatever reason at times there is less than expected,
never mind. The Lord will always lend His support to those who trust in Him: even “re oeconomica”.
In these days of Easter, the people who work in our Institute ought to reflect upon the words Pietro
said to the lame man: “Silver or gold I do not have, but what I have I give you: in the name of Jesus
Christ of Nazareth, get up and walk!” (Acts 4-6). So we must go forward bravely, without ever
forgetting that there is One above us who guides events and this should give us confidence but also
a great sense of responsibility.
IOR
Annual report 2016
Msgr. Battista Mario Salvatore Ricca
Prelate
Istituto per le Opere di Religione
MANAGEMENT REPORT
11
CHAPTER 1
STRATEGIC INFORMATION
1. PRESIDENT OF THE BOARD OF SUPERINTENDENCE’S MESSAGE
Sinceits appointment in July 2014, the Board of Superintendence has worked on the necessary transformation
of the IOR to serve with Prudence the Holy Father in fulfilling his mission as Universal
Pastor. This meant focusing on the nature and the quality of services offered to clients and to
the Church in a complex financial environment, the establishment of a framework with stronger
and clearer governance principles, strict compliance with applicable laws and regulations including
anti-money laundering procedures, the improvement of internal controls and risk management,
the execution of tax agreements with the United States of America and Italy, and the review of legal
issues in coordination with the appropriate Vatican authorities.
In 2016, the IOR has continued to make progress in rolling out the reform plan agreed upon by
the Board, supported by the new Directorate and the work of all its employees. In doing so, the
Board has given consideration to the words of the Holy Father regarding its particular responsibility
and particularly “the responsibility of guiding the institute’s strategic development in accordance
with its mission to serve, the Board should never lose sight of the ethical dimension of the choices
made in providing strategic guidance, recognizing that ethics is first and foremost in governing the
IOR, and may never be subordinated to profit, nor open to compromise”.
Collaboration between the Board and the Directorate
According to the Statute of the IOR, the Board has approved the business plan for 2016 which was
the continuation of the 2015 plan with a core focus on ethics and customer satisfaction and has
assisted the Directorate in its execution. It included the need to address the quality, reliability and
sustainability of investment solutions offered as well as the technical support offered to IOR client
base.
In addition, the Board has worked with the directorate towards strengthening the overall organization
including:
1. Ensuring compliance with law XVIII and Regulation No.1;
2. Strengthening the control functions with clearer governance principles;
3. Addressing human resource issues, such as increasing staff training, strengthening internal communication,
and hiring appropriate resources;
Jean-Baptiste de Franssu
President of the Board of Superintendence
Istituto per le Opere di Religione
IOR
Annual report 2016
12
4. Consolidation of the IT infrastructure;
5. Revising and strengthening the existing governance policy where necessary;
6. Continuation of the efforts of building new relationships with Italian banks, particularly in
the context of the tax agreement with Italy;
7. Continuing to reduce administrative costs, including dependency on outside consultants;
8. Developing a Risk Appetite Framework (RAF) for the IOR and reinforcing the risk-sensitive
approach and the Catholic investment criteria in the investment process as to strengthen the
quality of its products;
9. Addressing legacy issues to which IOR is exposed in coordination with the Vatican regulator
and judicial authorities.
Significant efforts were also made to allow the IOR to be FATCA compliant and, in addition, in
October, the Agreement between the Government of the Republic of Italy and the Holy See on tax
matters became effective. Both of these events represented a major milestone for the IOR and are
a very important step in all the efforts made to bring full transparency in the operations of the IOR.
The Board, after meeting with the Revisori and the external auditors, approved the Institute’s accounts
and the management report for 2016, ensuring compliance with applicable requirements
and new recommendations introduced by the AIF.
The net result for 2016 is Euro 36 million. This results – whose details are provided in “Financial
Statement” Section – reflects the continuous down trend of interest rate in Europe and the conservative
approach that the Institute has adopted on managing its assets since 2014. As described in
Management Report, Section 2, Part 1 – 2016 Business Review, this was achieved in a year of complex
financial and political evolutions.
In the meeting of the Board of Superintendence on 26 April 2017, attended by both the members
of the Revisori and the external auditors, the financial statements for 2016 and the proposed distribution
of profits to be made to the Holy See for 2016 were discussed and approved. As per the
Statutes these informations were provided to the Commission of Cardinals to enable them to decide
on the allocation of profits. The financial statements, prepared in accordance with IFRS, as
adopted by the Circular issued by the AIF, have been audited by Deloitte & Touche S.p.A.
2017 and beyond
All the efforts lead by the Board since 2014 will continue in 2017. Improving client experience at
IOR, working towards full compliance with AIF regulations, continuing its commitment to AntiMoney
laundering, working on the evolution of certain aspects of the IOR’s business model, developing
IOR’ approach to faith investing, furthering the work on governance, and consolidating
the role of the control functions will represent the Board’s main objectives.
Acknowledgements
I would like to thank all the Board members for their support, their contribution and their dedication.
Many of them have devoted a considerable amount of their time to help guide the IOR
through this year of transition and change.
In 2016, the Board has continued to strive towards building a close working relationship with the
Commission of Cardinals. I wish to extend my gratitude to the president and all the members for
their availability and support.
I also wish to express my appreciation for the work of Gian Franco Mammì, the Director General,
the Prelate Mgr. Ricca and to all employees of the IOR.
The work performed by the members of the Revisori and the external auditors have also been critical
to the progress made by the IOR.
IOR
Annual report 2016
13
2. MISSION, CUSTOMERS AND SERVICES
Mission of the Institute
The Istituto per le Opere di Religione (the “Institute” or “IOR”) is an institution of the Holy See,
founded on 27 June 1942 by Chirograph of His Holiness Pius XII. Its origins date back to the
“Commissione ad Pias Causas” established by Pope Leo XIII in 1887.
The mission of the IOR, established by its Statute, with reference to the Chirograph dated 1 March
1990 of His Holiness John Paul II, is “to provide for the custody and administration of goods transferred
or entrusted to the Institute by natural or legal persons, designated for religious works or charity.
The Institute can accept deposits of assets from entities or persons of the Holy See and of the
Vatican City State”.
The IOR strives to serve the global mission of the Catholic Church through the administration of
the entrusted assets and providing payment services to the Holy See and related entities, religious
orders, other Catholic institutions, clergy, employees of the Holy See and the accredited diplomatic
bodies.
The IOR is exclusively located on the sovereign territory of the Vatican City State and subject to
the regulations and legislation applicable therein. The IOR is supervised and regulated by the “Autorità
di Informazione Finanziaria” (AIF).
Customers of the IOR
Customers served by the Institute include:
a) Institutional counterparties (Sovereign Institutions of the Holy See and Vatican City State and
related entities, nunciatures and apostolic delegations, embassies and diplomats accredited to
the Holy See);
b) Non-institutional counterparties (Institutes of Consecrated Life and Societies of Apostolic Life,
Dioceses and other Vatican legal canonical or civil entities as legal persons; clerics and members
of Institutes of Consecrated Life and Societies of Apostolic Life, employees and retirees
of the Vatican as natural persons).
Most of the IOR’s clients are active in missions or perform charitable works at institutions such as
schools, hospitals or refugee camps.
The Catholic Church, through its institutions involved in missionary activities and charitable works,
is present throughout the world, even in countries with very basic infrastructure and underdeveloped
banking and payment systems.
In such cases, the IOR’s services are particularly valuable. For customers located in these areas, the
IOR is a bedrock, affirming itself as a trusted institution able to provide on-site services otherwise
lacking or absent. This is even more evident in those geographic areas with high political financial
instability.
Nature of the Institute’s services
On behalf of its clients, the Institute carries out financial activities authorized by the AIF, and offers
the following services: acceptance of deposits, asset management, certain custodial functions,
international payment transfers through correspondent banks, and holding salary and pension accounts
of employees of the Holy See and the Vatican City State.
IOR
Annual report 2016
14
The Institute protects its clients’ assets by primarily investing in financial instruments characterized
as very low risk (e.g. government bonds, bonds issued by institutions and international organizations,
as well as deposits in the interbank market).
Credit activity is residual and strictly subject to constraints of the internal policies as established
by the Board of Superintendence.
The IOR does not issue, underwrite or place securities.
Accounts opened at the IOR by authorized customers meet the requirements of the legislation on
preventing and combating money-laundering and the financing of terrorism in force in the Vatican
City State.
Customers are provided with services in IOR offices located in the Vatican City State. The IOR
has no other locations.
3. CORPORATE GOVERNANCE
The IOR’s governance structure is defined in its current Statutes. It consists of five bodies: Commission
of Cardinals, Prelate, Board of Superintendence, Directorate and the Revisori.
The Commission of Cardinals oversees the Institute’s adherence to its Statute. It appoints and removes
members of the Board of Superintendence.
Furthermore:
– It deliberates, after considering the financial statements and taking into account IOR’s own financing
needs, the distribution of profits;
– It proposes to the High Authority changes to the Statute;
– It deliberates the compensation due to members of the Board of Superintendence;
– It approves the appointment and removal of the Director General and of the Vice-Director made
by the Board of Superintendence;
– Resolution of any issues concerning the members of the Board of Superintendence and the Directorate.
IOR
Annual report 2016
Members of the Commission of Cardinals are appointed for a five year term, and can be reappointed.
The current members are:
Cardinal Josip Bozanic Archbishop of Zagabria
Cardinal Santos Abril y Castello President
Archpriest of the Papal Basilica of St Mary Major
Cardinal Christoph Schönborn Archbishop of Vienna
Cardinal Pietro Parolin Secretary of State Cardinal Thomas Christopher Collins
Archbishop of Toronto
Cardinal Jean-Louis Tauran President of the Pontifical Council
for Interreligious Dialoue
15
IOR
Annual report 2016
16
The Prelate is appointed by the Commission of Cardinals. The Prelate:
– Oversees the activities of the Institute and may have access to its acts and documents;
– Participates, as Secretary, in meetings of the Commission of Cardinals, drafting the minutes
of the meeting;
– Attends the meetings of the Board of Superintendence;
– Submits his comments to the Commission of Cardinals, notifying the Board of Superintendence.
Msgr. Battista Mario Salvatore Ricca was appointed as the Prelate of
the Institute in June 2013.
The Board of Superintendence is responsible for the administration and management of the Institute,
as well as the oversight and supervision of its financial, economic and operational activities.
In particular, the Board has the task of:
– Formulating general policy guidelines and basic strategies for the activities of the Institute in
line with its mission;
– Defining the criteria for the implementation of annual programs and objectives of the Directorate,
and approving its proposals;
– Verifying the economic-financial activities of the Institute;
– Monitoring compliance with established programs and objectives, with regard to investments
and other activities;
– Defining the most appropriate financial structure for the Institute, proposing the ways to improve
it, and in general, the best means to increase its assets and activities in the context of correct
adherence to economic-financial rules and in full compliance with the overall mission of
the Institute;
– Proposing to the Commission of Cardinals changes to the Statutes as long as they are unanimously
approved by the Board of Superintendence;
– Arranging for the issuance of the Institute’s Regulations, which are required to provide a detailed
description of the powers and competencies of the Board and of the Directorate;
– Delegating signing power in the name of the Institute to the Director General and, at their request,
the Vice-Director, Managers and Officers, in the manner prescribed in the Regulations;
– Approving the Financial Statements prepared by the Directorate.
The members of the Board of Superintendence are nominated by the Commission of Cardinals and
serve for a five year term, and can be reappointed. The Board consists of 7 members.
IOR
Annual report 2016
Jean-Baptiste de Franssu Mary Ann Glendon
President
Michael Hintze
Mauricio Larrain
Georg Freiherr von Boeselager
(since December 2016)
Scott C. Malpass
(since December 2016)
Javier Martin Romano
(since December 2016)
17
IOR
Annual report 2016
18
The Board of Superintendence fully performed its duties as defined by law and applicable procedures.
It continued to advise and supervise the Directorate in rolling out the agreed reform plan
and provided support for strategically important issues relating to the future development of the
IOR.
In December 2016, 3 new members were appointed to the Board following notably the resignations
of Dr. Carlo Salvatori and Dr. Clemens Boersig. The Board wishes to express its gratitude to
Carlo Salvatori and Clemens Boersig for all the help and counsel they provided to the IOR during
their tenure. The 3 new members, formally appointed on December 15, 2016, are Georg Freiherr
von Boeselager, Scott Malpass and Javier Marin Romano.
In 2016, the Board of Superintendence convened for six meetings and dealt with the strategic and
operating development of the IOR. All members participated in the meetings of the Board of Superintendence
and the committees to which they belong to for the year under review.
The Board continued its work on strengthening IOR standards of corporate governance.The meetings
of the Board of Superintendence continued to represent an open exchange of information and
ideas to find the appropriate resolutions to meet the needs of this unique institution. During these
meetings, the Board benefitted from each member’s specific expertise in various subject matters, and
the Board also held regular executive sessions to discuss specific topics in-depth.
Once approved, the minutes of all Board meetings were shared with the Revisori, the Directorate,
the Prelate and the Commission of Cardinals. During the year, the Board passed resolutions on a
number of matters after careful analysis and consultation, and in close coordination with the Directorate
and the Commission of Cardinals, for which the Board’s consent was mandatory.
In 2015, the Board created two Board committees to strengthen the Governance of the Institute
and the Board’s work, although such committees were not yet provided for by the Statute. An Audit
& Risk and HR & Remuneration committees were first established. In 2016, the Board created
a Past Abuses Committee to help and support the Board in its work of understanding and concluding
the investigation of legacy issues to which IOR was exposed. The Committee completed
its work at the end of January 2017, which included a thorough review of all cases and issued a detailed
set of recommended legal actions. The results of this work has been filed with Vatican Regulator
and Vatican Judicial Authorities.
Minutes were drafted for each committee meeting and distributed to all Board members, along with
a specific report presented by the respective presidents of those committees at each Board meeting
and an annual report at year end.
a) Members of the Human Resources and Remuneration Committee
Mary Ann Glendon – Chair
Carlo Salvatori (until May 2016)
Jean-Baptiste de Franssu (ex officio)
Mauricio Larrain
In attendance: Mario Busso, President of Revisori
b) Members of the Audit and Risk Committee
Sir Michael Hintze – Chair
Leslie Ferrar (non-board member)
Clemens Boersig (until May 2016)
Jean-Baptiste de Franssu (ex officio)
Wiet Pot (non-board member)
In attendance: Mario Busso, President of Revisori
IOR
Annual report 2016
19
c) Members of the Past Abuse Committee (June 2016 – January 2017)
Jean-Baptiste de Franssu – Chair
Sir Michael Hintze
In attendance: Giovanni Barbara, Member of Revisori
A focus was made in 2016 on the development of appropriate control functions, reinforcing their
independence and ensuring that activities and controls were properly carried out. Today, they are
comprised of:
– Internal Audit
– Risk management and Compliance
In accordance with law no. XVIII/2013 (see art. 27 et seq.) and best international practices, the Internal
Audit function reports to the Board with a dotted line to the Directorate.
In terms of second-level controls, Risk management and Compliance department is directly responsible,
among other things, for the AML/CFT (Anti Money Laundering/Combating the Financing
of Terrorism) activities.
The Revisori and the External Auditors have regularly and thoroughly carried out their activities during
2016, as expected.
IOR
Annual report 2016
The Directorate is responsible for all operational activities of the Institute and is accountable to the
Board of Superintendence.
The Directorate is appointed by the Board of Superintendence and approved by the Commission
of Cardinals and consists of:
The Revisori must:
– Verify at least quarterly, the administrative and accounting review of the Institute’s books and
records;
– If requested by the Board of Superintendence, the Revisori may conduct internal audits or other
inspections;
– Review the financial statements including the report of the Directorate and supporting documents,
provide written comments to the Board of Superintendence and present their observations
to the attention of the Directorate and the Prelate.
The Revisori consists of three members, appointed by the Board of Superintendence for a maximum
period of three years. They can be reappointed.
Current members are:
– Mario M. Busso, President of the Revisori
– Giovanni Barbara
– Luca Del Pico
Giulio Mattietti
“Aggiunto al Direttore”
with delegated functions
Gian Franco Mammì
Director General
20
IOR
Annual report 2016
21
4. IOR ORGANIZATION CHART
5. REGULATORY FRAMEWORK AND TAX REQUIREMENTS
Regulatory framework
The Institute is subject to the laws and regulations of the Holy See and Vatican City State.
The Vatican legal framework recognizes the Canon Law as the primary source of legislation and
the primary criterion for its interpretation. Furthermore, there are six organic laws and other ordinary
laws specific to the Vatican City State. For matters not covered by Vatican laws, laws and
other regulations issued by the Italian Republic are observed as supplementary, subject to prior approval
by the competent Vatican authority.They are adopted on the condition that they do not conflict
with the doctrine of divine law, the general principles of Canon Law or the provisions of the
Lateran Pact and subsequent Agreements, and provided that they are applicable to the state of affairs
existing in Vatican City (See law No LXXI on the source of law, promulgated by Pope Benedict
XVI on 1 October 2008).
According to article 1.4 of Law no. LXXI on the sources of law, the legal framework must also conform
to the general norms of international law, and to those arising from treaties and other agreements
to which the Holy See is part of.
The Institute is subject to Law no. XVIII of 8 October 2013 that covers norms of transparency,
supervision, and financial intelligence and, as an entity that carries out financial activities on a professional
basis in Vatican City State, it is also subject to Regulation No. 1 “Prudential Supervision
of Entities carrying out financial activities on a professional basis” issued by AIF and enacted on
13 January 2015.
The Regulation No. 1, establishing a clear system of authorization, stipulates the criteria for the organization
and management of entities and mechanisms of internal control.
IOR
Annual report 2016
DIPARTIMENTO
BILANCIO
DIPARTIMENTO
IT E SICUREZZA
DIPARTIMENTO
OPERATIONS
DIPARTIMENTO
FINANZA
DIPARTIMENTO
GESTIONI
PATRIMONIALI
DIPARTIMENTO
RAPPORTI CON
LA CLIENTELA
COMMISSIONE CARDINALIZIA
PRELATO
RISK MANAGEMENT
E COMPLIANCE
SEGRETERIA
DI PRESIDENZA
LEGALE
INTERNAL AUDIT
RISK MANAGEMENT
COMPLIANCE ED
ANTIRICICLAGGIO
CONSIGLIO DI SOVRINTENDENZA
DIREZIONE SEGRETERIA
DI DIREZIONE
SEGRETERIA
AMMINISTRATIVA
ORGANIZZAZIONE E
RISORSE UMANE
DIPENDENZA FUNZIONALE DIPENDENZA GERARCHICA DIPENDENZA AMMINISTRATIVA
On 15 December 2016, the AIF promulgated the “Circular relating to the preparation of the annual
financial statements and the consolidated financial statements of entities carrying out financial
activities on a professional basis”. These financial statements have been prepared in accordance
with the aforementioned Circular.
Tax requirements
On 15 October 2016 the “Agreement between the Government of the Italian Republic and the Holy
See in tax matters” became effective. The Agreement had also a two-fold impact on the Institute’s
activities. In fact, the agreement provides for clients resident in Italy for tax purposes, on one hand,
the regularization of the client positions in the prior years from 2010 to 2015 and, on the other
hand, henceforth, that clients fulfill their tax debts through a Fiscal Representative chosen by the
Institute. Concerning previous years it has been provided by a specific implementing act of the Secretary
of State that the IOR assist its clients in compiling the instance with reference to the data
regarding the investments held at the Institute and the calculation of taxes due, in addition to all
the related administrative tasks. For the current and future period, the IOR must provide the calculations
and withhold taxes to customers which will be paid to the Italian Government via an Italian
tax representative.
This required significant efforts to be made prior to the affectiveness of the agreement and in the
following months. A specifictask force was established at the Institute to provide assistance to clients
with the calculation of the amounts due and related administrative activities.
Effective 2015, the IOR is subject also to the Foreign Account Tax Compliance Act (FATCA), a
United States federal law that requires U.S. persons, including individuals who live outside the
United States, to report their financial accounts held outside of the United States to the U.S. Internal
Revenue Service (IRS).
FATCA also requires foreign financial institutions to report to the IRS the accounts of their U.S.
clients. In this context, the Holy See has reached an Intergovernmental agreement (IGA) with the
United States signed in June 2015. Under the terms of the IGA, the Holy See is a jurisdiction treated
by the US Authorities as if the IGA was effective as of 30 November 2014, and the IOR has been
assigned an identification code (GIIN) by the IRS. The IOR fully complies with the terms of the
IGA.
6. PROPOSAL OF DISTRIBUTION OF THE NET PROFIT FOR THE YEAR
For the net profit for the year ended 31 December 2016 amounting to EUR 36.0m, the Board of
Superintendence intends to propose to the Commission of Cardinals, that the profits be distributed
in full without making any provision to the Reserves, also considering the adequacy of capital
(for further details see Part 6 – paragraph 6.2.2 “Capital adequacy”).
22
IOR
Annual report 2016
CHAPTER 2
OPERATIONAL INFORMATION
1. 2016 BUSINESS REVIEW
Macroeconomic environment
Below is an overview of the macroeconomic environment that characterized 2016, with particular
reference to those markets and events that had the strongest influence on the performance of the
Institute’s portfolio.
In 2016, financial market trends were characterized by the sharp increase in uncertainty and there
were also several factors that increased risk aversion. In the first few weeks of the year, fears of a slowdown
in advanced economies intensified, first and foremost in the US economy, in addition to fears
of a contraction in the Chinese economy.The expectations of a new economic crisis that could have
a domino effect to all the international markets therefore increased. Concerns over China also affected
the market for raw materials and oil prices dropped to the lowest level of the year.
This turbulent start was followed by a mild recovery that lasted until the major electoral appointments
of the year, the British Brexit referendum, the US elections and the Italian constitutional referendum.
Although the outcomes were not what financial operators had hoped for, the markets
proved to be unexpectedly resilient. In the UK, the outcome of the referendum to decide on whether
or not to remain in the European Union resulted in a sharp devaluation of the Pound and led to
the adoption of expansionary monetary measures. In the United States, the “shock” of Trump’s victory
was instead short-lived. His victory was viewed as a turning point attributed to announcements
of implementation of fiscal stimulus measures, tax cuts and a corporate law reform, fuelling expectations
of higher inflation. In Italy, while the victory of the “No” vote on the constitutional reform
last December led to Prime Minister Renzi’s resignation, it did not result in the feared meltdown
on Italian government bonds.
At the macroeconomic level, 2016 was a year of modest growth for both Europe and the United
States, with contrasting trends during the year. US economic growth was lower than expected in
the first half. Indicators improved half way through the year, signalling the possibility of an increase
in manufacturing activity towards the end of the year. However, 2016 ended with a slowdown in
economic growth at 1.9% in the fourth quarter, although employment rates and incomes continued
to grow. In the Eurozone, there were conflicting economic indicators. Quarterly GDP growth
slowed during the April – June period, but the annual change remained sufficient to promote a grad- 23
IOR
Annual report 2016
Gian Franco Mammì
Director General
Istituto per le Opere di Religione
ual improvement in the labor market with a steady absorption of the unemployment rate, which
still remains high. Inflation gradually increased towards the end of the year due to the rise in energy
prices.
Central Bank Monetary Policies continued to be expansionary in many countries over the year. In
March, the ECB cut interest rates, introduced new monetary stimulus measures extending, at least
until the end of 2017, the government bond purchase program in order to jump start economic
growth. By contrast, in the wake of the economic improvement, the US Federal Reserve decided
to raise interest rates by 25 basis points in December, widely expected by the market.
The bond markets reacted positively for most of the year. The ECB’s measures, combined with low
inflation, have lowered yields on government securities in all sectors, with the yield on German tenyear
bonds becoming negative. Italian government securities also benefited from the ECB’s purchase
program that helped keepTreasury bond yields low (10-yearTreasury bond yield was 1.25% in midyear,
after having peaked at 1.7% in February) and limited the spread on German bond yields during
turbulent market phases.Towards the end of the year, US, Japanese and EuropeanTreasury bond
yields rose significantly, resulting in a significant reversal of the bond curve as a result of a change
in the expectations of rising interest rates and expansionary fiscal policies aimed to counter weak
economic growth. Bond rates remained very low but with the risk of an increase.
During 2016 the stock market was severely affected by political events, with European stocks showing
lower yield trends compared to the US given the concerns about a possible disruption in the European
political scenario, also as a result of the UK referendum.The first nine months of 2016 were
characterized by pronounced volatility and heightened risk aversion among investors in the main
international markets, particularly, in the Eurozone and Asia. In June, the unexpected victory of the
“Leave” campaign in the Brexit referendum brought about a sharp downward adjustment in share
prices and a new increase in investors’ risk aversion (share prices in Italy experienced a sharp decline
with a mid-year high of -25%, with twice that on the Italian banking sector index) before recovering
towards the end of the year thanks to the improvement in the US economy, the continued flow
of liquidity provided by monetary policies and the expectations of procyclical fiscal policies.
Currencies were at the forefront of news reports in 2016, particularly in the UK following the outcome
of the referendum: in fact, the Pound immediately fell 10% against the dollar to close the year
at -16%. The Euro declined against the dollar, due to the increasing marked divergence in terms
of monetary policy. Overall, 2016 was another very positive year for the US dollar, against which
the Euro and the Swiss Franc, in addition to the Pound, lost value. Instead, the Japanese Yen held
its ground.
Lastly, with regards to raw materials, we experienced fluctuations in the prices of gold and oil. After
almost two years of decrease in the prior of oil, the major commodity indices seems to have stabilized,
going from 26 dollars per barrel in January 2016 to 50 dollars towards the end of year, in
part to the agreement reached by OPEC. Gold, as the main safe haven asset in times of high risk
aversion, peaked in the first half of 2016, having risen from its lowest price at 1061$/oz in December
up to 1370$/oz in July. In the second half of the year, except for the short-lived surge that followed
the election of Donald Trump, gold prices suffered to the point of reaching its lowest price
in 10 months: 1,122.35$/oz, mainly because of the FED’s announcement of an increase in interest
rates and the expectation of another three increases in 2017.
Composition of the Client base
At the end of 2016, the IOR had 14,960 clients (2015: 14,801), of which the vast majority, measured
by assets entrusted to the Institute, were legal persons under Canon Law.The IOR’s customers
have a common characteristic, which is that they are part of and serve the Catholic Church (seeclient
definition in Chapter 1). 24
IOR
Annual report 2016
IOR
Annual report 2016
25
Measured by assets entrusted, the most important group of clients, was religious orders. They accounted
for more than half of our client base in 2016 (54%), followed by Roman Curia departments,
Holy See Offices and nunciatures (11%), entities of Canon Law (9%), cardinals, bishops
and clergy (8%), episcopal conferences, dioceses and parishes (8%), with the remainder split between
various others, such as Vatican employees and pensioners and Canon Law foundations.
In addition to depositing funds with us, we manage our clients’ portfolios of assets on their behalf
or act as custodians. As of 31 December 2016, the net value of assets held in managed portfolios
was EUR 3.1bn (2015: EUR 3.2bn), the net value of assets held in non-managed portfolios was
EUR 554.8m (2015: EUR 646.2m) and the value ofcustomer deposits was EUR 2.0bn (2015: EUR
1.9bn), resulting in EUR 5.7bn in total client assets (2015: EUR 5.8bn).
(in thousand Euro)
2016 2015
In Balance Off Balance Total In Balance Off Balance Total
Sheet Sheet Sheet Sheet
Customer deposits
(including Legates) 2,028,973 2,028,973 1,946,854 1,946,854
Assets under Custody 554,763 554,763 646,161 646,161
Assets under Management 410,563 * 2,700,366 3,110,929 424,815 2,760,870 3,185,685
Total 2,439,536 3,255,129 5,694,665 2,371,669 3,407,031 5,778,700
*Deposits of Assets Management are net of commissions collected in the first days of 2017.
Assets under Custody mainly include client-owned securities held at the IOR for custodial purposes.
The clients make all investment decisions and the IOR has no discretionary power to manage these
assets, provided that such decisions are in accordance with the role and mission of the Institute. For
the purpose of table above, securities, gold and precious metals under custody are stated at market
values.
Assets under Management consist mainly of client-owned securities held at the IOR for management
purposes. Investment decisions are made by the IOR on the basis of portfolio management
mandates signed with its clients. For the purpose of table above, securities under management are
stated at market values.
Income Statement
In 2016, IOR’s Net profit was EUR 36.0m (2015: EUR 16.1m).Theincreasefrom 2015 was mainly
due to improved results from Net Income for trading activities, to the remeasurement of a provision
for tax remediation to foreign countries recognized in 2015 and to the decrease in Administrative
expenses.The results were partially offset by the decrease in Interest Margin and Net fee and
commission income.
A brief overview of the main components of the Income Statement is presented below.
The most significant source of revenues is the profit derived from Treasury activities on proprietary
portfolios.
The most important component was derived from bond yield which contributed for EUR 39.6 million
(interests EUR 38,0 million plus trading results EUR 1.6 milion).
Interest Margin amounting to EUR 36.7m decreased by 16% compared to EUR 43.6m in 2015.
This was mainly affected by the decline in the yield on investments in securities and bank deposits
and a decline in interest paid to customers, although the average amounts of capital invested re-
IOR
Annual report 2016
26
mained unchanged at EUR 2.9bn (2015: EUR 2.9bn); The average rate on customer deposits declined
to 0.11% in 2016 from 0.22% in 2015, while the average yield on investments in securities
and bank deposits declined to 1.35% in 2016 from 1.64% in 2015. Accordingly, the spread
between the average rate received on assets and the average rate paid on liabilities decreased to 1.24%
from 1.42%.This was mainly due to the expiration of securities in 2016 purchased in previous years
with a nominal interest rate higher than those currently available on market.
Net Income for trading activities recognised a net loss of EUR 9.0m compared to a net loss of EUR
15.4m in 2015. The result was mainly affected by the decrease in UCI unit investment compared
to 2015, amounting to EUR -12.8 milion. The improvement in the results was mainly due to the
positive performance of the bonds held in the proprietary portfolio in 2016, compared to 2015,
to market trends during the year.
More specifically, debt securities recognised a positive total net profit, including gains and losses
from trading and gains and losses from valuation, amounting to EUR 1.6m in 2016 compared to
a loss of EUR 17.1m in 2015.
Equity securities recorded a profit of EUR 94,000 in 2016, versus a loss of EUR 307,000 in 2015,
while FX activity contributed for EUR 2.0 million versus EUR 1.9 million in 2015.
The value of UCI unit investment decreased by 2015 due to the write-down of an investment fund
held in the portfolio in addition to other losses for a total of EUR 12.8 million in 2016 versus EUR
149.000 in 2015.
Dividends increased by 7.8% to EUR 2.1m from EUR 2.0m in 2015.
Net Fee and Commission income decreased 15.9% to EUR 12.8m in 2016 from EUR 15.2m in
2015. Fee and Commission Income decreased 10.6% to EUR 15.8m in 2016, from EUR 17.7m
in 2015, while Fee and Commission Expense rose to EUR 3.0m in 2016 from EUR 2.5m in 2015
(+22.1%).
The most important component of the Fee and Commission Income was commissions from Asset
Management services, which decreased 8.7% to EUR 12.5m in 2016 from EUR 13.7m in 2015.
This was mainly due to the shift of some customers to asset management lines, mainly composed
by bond securities, with lower commissions than lines composed mainly by equity securities, that
the same clients owned before.
The increase in Fee and Commission Expense was mainly due to the fees paid for bank deposits
(EUR 571,000 in 2016), paid for the first time in 2016, and to the increase in commission paid
for custody and administration of securities, amounting to EUR 1.6m in 2016 from EUR 0.9m
in 2015. This is partially offset by the decrease in commission paid for trading in financial instruments,
which decreased to EUR 83,000 in 2016, from EUR 648,000 in 2015, due to the fact that,
starting from 2016, clients directly pay commissions on securities transactions whereas previously,
they were paid by the Institute and collected later.
Administrative Expenses were EUR 19.1m in 2016 (2015: EUR 23.4m). This includes Staff Expenses
of EUR 10.2m in 2016, in reduction with the prior year amount (2015: EUR 11.3m, or –
9.1%). As of December 31, 2016, the IOR had a total of 102 personnel (2015: 109). During the
year, six employees retired and one resigned.
Administrative expenses also include expenses for professional services, which decreased from
EUR 7.6m in 2015 to EUR 4.0m in 2016.This was due to lower extraordinary costs incurred during
the year from the completion of certain projects.
IOR
Annual report 2016
27
Other administrative expenses slightly increased by 7.2% to EUR 4.9m in 2016 from EUR 4.6m
in 2015 due to higher costs incurred for maintenance.
Net provisions to risks and charges in 2016 amounted to a profit of EUR 13.0m (2015: loss of
EUR 16.5m) due to the reestimation of a tax provision for exposure in foreign countries recorded
in 2015.
Other Operating Income (Expense) recognised income of EUR 7,000 (2015: income of EUR
10.5m); the difference, compaired to the previous year, is mainly due to EUR 13.6m of extraordinary
income recorded in 2015 related to the closing of an issue from prior years.
Balance Sheet
As of 31 December 2016, total assets on the IOR’s balance sheet was EUR 3.3bn (2015: EUR
3.2bn), with equity of EUR 672.6m (2015: EUR 670.3m).
On the Liabilities side, Due to customers is the most significant line item, representing 92.4% of
total liabilities. The balance slightly increased from the prior year, amounting to EUR 2.4bn
(+3.3%). Customer deposits increased by EUR 75.5m, while asset management liquidity decreased
by EUR 14.3m.
Our clients expect a conservative approach in financial management by the IOR, with investments
in liquid securities and high quality credit risk. Investments in the stock market and similar financial
instruments are relatively limited and based on companies with strong fundamentals which generally
tend to pay high dividends.
No funding activities are carried out on the interbank market and IOR does not issue debt securities.
As previously reported in Chapter 1, credit activity is residual and strictly subject to constraints of
the internal policies as established by the Board of Superintendence.
The asset side of the balance sheet mainly reflects bank deposits and securities, and less than 3%
of total assets is held in UCI units and equities.
Bank Deposits totaled EUR 643.2m at the end of 2016 (2015: EUR 644.1m). These mainly consisted
of EUR 457.6m in deposits on demand (2015: EUR 265.4m), and EUR 108.5m in term
deposits in the interbank lending market (2015: EUR 292.5m). The remaining part, EUR 77.1m
(2015: EUR 60.7) concerned term deposits with APSA.
The value of IOR Securities (debt securities, equity securities and investment funds) was EUR 2.5bn
in 2016 (2015: EUR 2.3bn). Bonds, at EUR 2.4bn, were the most significant investments, representing
96.3% of the securities held as of 31 December 2016, while equities accounted for 2.4%,
and investment funds for 1.3%. As previously explained, the volume of the securities in the portfolio
slightly increased compared to 2015, while the portfolio composition remained unchanged.
Profitability ratios
The table below highlights the main economical, financial and productivity ratios:
Profitability ratios (%) 2016 2015
ROE (Returns on Equity) 5.66% 2.47%
ROA (Returns on Assets) 1.10% 0.50%
Operating costs / Earnings margin 15.52% 66.05%
Interest margin / Earnings margin 83.15% 96.03%
Net fee and commission income / Earnings margin 29.05% 33.51%
Interest margin / Total Assets 1.12% 1.36%
Earnings margin / Total Assets 1.35% 1.42%
The ratios ROE and ROA recorded an increase compared with the previous year due to the increase
in Net profit.
The profitability, explained from the ratio “interest margin / total assets”, amounted in 2016 to
1.12% against 1.36% recorded in 2015, due to the reduction of interest margin; the ratio “earnings
margin / total assets” recorded almost a result in line with the previous year (1.35% in 2016,
1.42% in 2015).
These two ratios showed that the Institute ability to create income slightly decreased, but the negative
effects were balanced by the decrease of operating costs, showing good flexibility in reacting
promptly to market changes.
Other aspects
The IOR does not issue securities, neither underwrite or place securities; it protects its client assets
by primarily investing in financial instruments characterized as very low risk (e.g. government
bonds, bonds issued by institutions and international organizations, as well as deposits in the interbank
market).
The IOR has no branches and provide services only at the IOR office located in the Vatican City
State.
The Institute owns 100% of the real estate company SGIR S.r.l., with registered office in Italy. The
Institute has a long-term zero-interest loan to its subsidiary SGIR S.r.l., amounting to EUR 3.3m.
During 2015, the Institute signed a loan agreement for the use of 4 real estate properties at no cost
with its subsidiary SGRI S.r.l. During 2016, SGIR S.r.l. did not earn rental income on these properties.
2. FORECAST FOR 2017
In the first months of 2017, the Institute’s activity was in line with the Strategic Plan approved by
the Board of Superintendence in January 2017.The main objective is to improve the quality of services
offered to clients. The forecast for 2017 is a stable base of customer deposits, a result of a balance
between the outflows due to the tax agreements signed between the Holy See and other countries
and inflows due to the increased quality of services offered. By the end of 2018, the results of
this work should be apparent.
The effort, already undertaken in recent years, to comply with Holy See laws and regulations and
international best practice will continue to be implemented.The same will apply with international
tax matters. 28
IOR
Annual report 2016
The issues of transparency and reputation will obviously be the core in this process of growth; many
steps and activities have been taken from 2013 to make the Institute more transparent and aligned
with international best practices.
The IOR will continue to operate in accordance with his Mission that is to serve the Holy Father
with prudence, in His mission as the Universal Pastor, through the provision of dedicated financial
advisory, in complete compliance with Vatican and international laws in force and with what
the Holy Father said “the main goal of the IOR cannot be to have the maximum possible gain, but
should be goals that are compatible with the norms of morality, consistent efficiency and practices
respecting the specificity of its nature and exemplarity in its mode of operation”.
29
IOR
Annual report 2016
FINANCIAL STATEMENTS
IOR
Annual report 2016
33
BALANCE SHEET
IOR financial statements for 2016 are prepared in accordance with the Circular concerning the annual
financial statements and the consolidated financial statements of entities carrying out financial
activities on a professional basis, issued by Authority of Financial Information on 15 December
2016.
The 2015 figures have been reclassified according to the provisions of the Circular above mentioned.
(in Euro)
ASSETS 2016 2015
10. Cash and cash equivalents 50,850,340 114,737,182
20. Financial assets held for trading 1,918,104,346 1,667,965,933
40. Financial assets available for sale 6,664,406 15,167,415
50. Financial assets held to maturity 558,955,610 614,818,290
60. Due from banks 643,229,012 644,089,443
70. Due from customers 29,152,785 86,233,851
100. Investment in subsidiaries 15,834,950 15,834,950
110. Tangible assets 3,095,565 2,981,724
120. Intangible assets 1,043,850 874,809
150. Other assets 41,958,806 41,556,606
Total Assets 3,268,889,670 3,204,260,203
LIABILITIES AND EQUITY 2016 2015
10. Due to banks 10,597,312
20. Due to customers 2,398,924,457 2,323,402,903
100. Legates 47,074,644 48,266,303
110. Other liabilities 18,709,825 20,086,868
120. Staff severance fund 6,992,585 6,788,489
130. Provision for risks and charges 124,588,179 124,838,475
(a) Provisions for pensions and similar obligations 121,088,179 108,338,475
(b) Other provisions 3,500,000 16,500,000
140. Valuation reserves (45,534,851) (27,981,254)
160. Reserves 382,134,172 382,134,172
(a) Unavailable reserves 100,000,000 100,000,000
(b) Available reserves 282,134,172 282,134,172
170. Capital 300,000,000 300,000,000
180. Net profit for the year 36,000,659 16,126,935
Total Liabilities and Equity 3,268,889,670 3,204,260,203
34
IOR
Annual report 2016
INCOME STATEMENT
(in Euro)
INCOME STATEMENT 2016 2015
10. Interest and similar income 39,831,730 48,640,984
20. Interest and similar expense (3,168,836) (5,002,810)
30. Interest margin 36,662,894 43,638,174
40. Fee and commission income 15,836,850 17,709,979
50. Fee and commission expense (3,029,222) (2,481,584)
60. Net fee and commission income 12,807,628 15,228,394
70. Dividends and similar income 2,107,013 1,954,367
80. Net income for trading activities (8,982,924) (15,377,567)
100. Profit (loss) on disposal or repurchase of: 1,499,109
(b) Financial assets available for sale 1,499,109
120. Intermediation margin 44,093,720 45,443,368
130. Net losses/reversal on impairment: (1,331,864) 197,034
(a) Receivables (1,045,306) 352,909
(b) Financial assets available for sale (148,314)
(d) Other financial operations (138,244) (155,875)
140. Net income from financial operations 42,761,856 45,640,402
150. Administrative expenses: (19,085,562) (23,427,846)
(a) Staff expenses (10,244,959) (11,268,224)
(b) Professional services expenses (3,961,573) (7,607,374)
(c) Other administrative expenses (4,879,030) (4,552,248)
160. Net provisions to risks and charges 13,000,000 (16,500,000)
170. Net value adjustments to/recoveries on tangible assets (82,789) (63,868)
180. Net value adjustments to/recoveries on intangible assets (682,777) (511,793)
190. Other operating income (expense) 7,287 10,489,260
200. Operating costs (6,843,841) (30,014,247)
220. Net result of fair value valuation of tangible and intangible assets 82,644 500,780
250. Profit (loss) from current operations before taxes 36,000,659 16,126,935
270. Profit (loss) from current operations after taxes 36,000,659 16,126,935
290. Profit (loss) for the year 36,000,659 16,126,935
IOR
Annual report 2016
35
STATEMENT OF COMPREHENSIVE INCOME
(in Euro)
2016 2015
10. Profit (loss) for the year 36,000,659 16,126,935
Items that will not be reclassified to Income Statement
40. Defined benefit plans (13,275,014) 8,880,551
Items that are or may be reclassified to Income Statement
100. Financial assets available for sale (4,278,583) 4,777,470
130. Total other income items (17,553,597) 13,658,021
Comprehensive income (item 10 + item 130) 18,447,062 29,784,956
STATEMENT OF CHANGES IN EQUITY
(in Euro)
2016 Allocation of Changes during the year
previous year profit
Total net equity Changes in Total net equity Reserves Dividends Changes Extra Comprehensive Net
at 31.12.2015 opening at 01.01.2016 and other in reserves dividend income Equity at
balances allocations distribution 2016 31.12.2016
Capital 300,000,000 300,000,000 300,000,000
Reserves
(a) unavailable 100,000,000 100,000,000 100,000,000
(b) available 282,134,172 282,134,172 282,134,172
(c) other
Valuation
reserves (27,981,254) (27,981,254) (17,553,597) (45,534,851)
Net profit
(loss) for
the year 16,126,935 16,126,935 (16,126,935) 36,000,659 36,000,659
Net Equity 670,279,853 670,279,853 (16,126,935) 18,447,061 672,599,980
(in Euro)
2015 Allocation of Changes during the year
previous year profit
Total net equity Changes in Total net equity Reserves Dividends Changes Extra Comprehensive Net
at 31.12.2014 opening at 01.01.2015 and other in reserves dividend income Equity at
balances allocations distribution 2015 31.12.2015
Capital 300,000,000 300,000,000 300,000,000
Reserves
(a) unavailable 100,000,000 100,000,000 100,000,000
(b) available 267,300,717 267,300,717 14,833,455 282,134,172
(c) other
Valuation
reserves (41,639,275) (41,639,275) 13,658,021 (27,981,254)
Net profit (loss)
for the year 69,333,455 69,333,455 (14,833,455) (54,500,000) 16,126,935 16,126,935
Net Equity 694,994,898 694,994,898 (54,500,000) 29,784,954 670,279,853
36
IOR
Annual report 2016
CASH FLOW STATEMENT
(in Euro)
2016 2015
A. Operating activities
1. Management 42,833,712 48,037,261
Interest income 48,639,880 55,060,588
Interest expense (3,168,341) (7,659,915)
Dividends and similar income 2,107,013 1,954,367
Net commissions 12,807,628 15,228,394
Realised profit (loss) from trading activities 2,024,715 (6,521,066)
Staff expenses (10,566,173) (10,043,861)
Other administrative expenses (8,840,603) (13,323,635)
Other income (expense) (170,407) 13,342,389
2. Cash generated by/used in financial assets (206,618,819) 68,576,005
Financial assets held for trading (266,429,528) 41,765,424
Financial assets available for sale 5,575,219
Due from banks: on demand (192,197,353) 17,854,851
Due from banks: other receivables 192,249,112 (48,714,530)
Due from customers 54,408,236 61,305,128
Other assets (224,505) (3,634,868)
3. Cash generated by/used in financial liabilities 62,216,802 13,182,507
Due to banks: on demand (10,591,428) 10,581,312
Due to banks: other payables
Due from customers 75,515,176 12,469,195
Outstanding securities
Legates (1,191,659)
Financial liabilities held for trading
Financial liabilities carried at fair value
Other liabilities (1,515,287) (9,868,000)
Cash generated by/used in operating activities (101,568,305) 129,795,773
B. Investing activities
1. Cash generated by: 53,250,000 64,986,522
Disposals of investments in subsidiaries
Dividends received on investments in subsidiaries
Disposal/reimbursement of financial assets held to maturity 53,250,000 64,986,522
Disposals of tangible assets
Disposals of intangible assets
2. Cash used in: (965,804) (34,206,681)
Purchases of investments in subsidiaries
Purchases of financial assets held to maturity (33,412,000)
Purchases of tangible assets (113,986) (240,681)
Purchases of intangible assets (851,818) (554,000)
Cash generated by/used in investing activities 52,284,196 30,779,841
C. Financing activities
Issues/purchases of capital instrument
Dividend distribution and other purposes (16,126,935) (54,500,000)
Cash generated by/used in financing activities (16,126,935) (54,500,000)
Cash generated/used during the year (65,411,044) 106,075,614
IOR
Annual report 2016
37
Items 2016 2015
Cash and cash equivalents at beginning of the period 114,737,182 16,351,306
Cash generated/used during the year (65,411,044) 106,075,614
Cash and cash equivalents: forex effect 1,524,202 (7,689,738)
Cash and cash equivalents at end of the period 50,850,340 114,737,182
EXPLANATORY NOTES
PART 1. ACCOUNTING POLICIES
1.1 GENERAL INFORMATION
1.1.1 Statement of compliance with accounting standards
The 2016 financial statement have been prepared in accordance with the Circular concerning the
annual financial statements and the consolidated financial statements of entities carrying out financial
activities on a professional basis, issued by Authority of Financial Information on 15 December
2016.
As stated in the Circular, the financial statements must be prepared in accordance with the “International
Accounting Standards – IAS”, the “International Financial Reporting Standards – IFRS”
and related Interpretations (“Interpretations SIC / IFRIC”), as adopted by the Vatican in a special
arrangement to the Monetary Convention between the European Union and the State of the Vatican
City on 17 December 2009.
The 2015 figures have been reclassified according to the provisions of the above mentioned Circular.
1.1.2 Accounting policies
The financial statements consist of the Balance Sheet, the Income Statement, the Statement of Comprehensive
Income, the Cash Flow Statement, the Statement of Changes in Equity and the Explanatory
Notes.
Disclosures under IFRS 7 “Financial Instruments, disclosures” about the nature and extent of risks
have been included in Part V “Information on Risks and Hedging Policies”.
The accounting principles and valuation methods applied in the preparation of these financial statements,
detailed below, are consistent with those of the previous financial year, except for new standards,
new interpretations, or amendments of standards and except for gold, silver, medals and precious
coins evaluation criteria. According to AIF Circular and IAS 2, starting from 1 January 2016,
gold, silver, medals and precious coins are measured at the lower of cost and net estimated recoverable
amount, as explained in the Section 1.1.4 “Other Aspects”.
The financial statements of the Institute are prepared in Euro, while the explanatory notes are expressed
in thousand Euro.
For the various items, the 2016 figures and corresponding values for the previous year are provided.
Where necessary, the comparative figures have been adjusted to conform to changes in presentations
in the current year.
The financial statements are prepared in Italian.
The financial statements of the IOR were prepared on a going concern basis in accordance with
IAS 1 “Presentation of Financial Statements”. As of the date of the approval of the financial statements,
there were no material uncertainties and therefore no significant doubt regarding the Institute’s
ability to continue as a going concern in the foreseeable future. 38
IOR
Annual report 2016
The financial statements fairly present the financial position, financial performance and cash
flows of the Institute.
The preparation of the financial statements requires the Directorate to make certain estimates and
assumptions about the future where actual results may differ. Estimates and assumptions affect the
reported amounts of certain assets, liabilities, revenues and expenses in the financial statements. In
addition, changes in assumptions may have a significant impact on the financial statements in the
year in which the assumptions change.
The preparation of the financial statements also requires the Directorate to exercise judgements in
applying the IOR’s accounting policies to estimate the carrying value of assets and liabilities not
readily obtainable from other sources.
The Directorate believes that the underlying assumptions are appropriate and that the IOR’s financial
statements fairly present its financial positions and results. All estimates are based on historical
experience and/or expectations with regard to future events that seem reasonable on the basis
of information known at the time of the estimate. They are also reassessed on a regular basis and
the effects of any variation are immediately reflected in the financial statements.
Those areas involving a higher degree of judgement or complexity, or areas where assumptions and
estimates are significant to the financial statements, are disclosed in Section 1.1.4.1. “Critical accounting
estimates and judgements”.
The financial statements do not reflect a provision for taxes because there is no corporate income
tax in Vatican City State.
The Institute, given the immaterial value of its subsidiary, does not prepare consolidated financial
statements in accordance with the provisions of the Conceptual Framework (QC6 – QC11) of
IAS/IFRS, since the additional information coming from the consolidated financial statements
would be of little relevance for the users of the financial statements.
The Institute provides the additional information required by IFRS 12 “Disclosure of interests in
other entities” in Part 5, Section 5.2.6 “Disclosure of unconsolidated structured entities for accounting
purposes”.
The financial statements of the Institute are prepared by the Directorate and approved by the Board
of Superintendence, which will be submitted to the Commission of Cardinals.
The Commission of Cardinals acknowledges the financial statements and decides on the distribution
of profits, after taking into account the IOR’s own financing needs.
1.1.3 Subsequent events
According the provisions of IAS 10, all events that took place subsequent to 31 December 2016
have been evaluated in the preparation of the 2016 Financial Statements.
1.1.4 Other aspects
Starting from the financial year 2016 IOR applies the provisions arranged by the AIF Circular issued
on 15 December 2016 about gold, silver, medals and precious coins. The Circular provides
that gold, silver, medals and precious coins are normally carried at the lower of cost (see IAS 2, paragraphs
10-18) and net estimated recoverable amount (see IAS 2 paragraphs 6-7). 39
IOR
Annual report 2016
According to IAS 8, the Institute considered the value as at 1 January 2015 (31 December 2014)
as cost of the gold, silver and precious medals and coins, because was not feasible to make a measurement
for the prior years.
As of 31 December 2015, the value of gold was lower than the cost and this involved only a reclassification
of the loss, already recorded in the previous financial year, from the item “Net income
for trading activities” to the item “Other operating income (expense)”; no other economic impacts
were recorded.
The gold, silver, medals and precious coins held by the Institute are classified in the Balance Sheet,
Item 150 Assets – “Other assets”. Gold is mainly deposited with the U.S. Federal Reserve, while
medals and precious coins are kept in the IOR vaults.
1.1.4.1 Critical accounting estimates and judgements
Critical judgements in applying the Institute accounting policies
In the process of applying the accounting policies adopted by IOR, which are described in Section
II, there may be circumstances that lead the Directorate to make judgements that have a significant
impact on the amounts recognized in the financial statements.
Such circumstances and related judgements may be part of the valuation process used for financial
instruments. The Directorate makes critical judgements when deciding the asset category for classification,
determining whether a market is active or not, whether the asset is liquid or illiquid, market
inputs and parameters to be used, when they must be reviewed, and assessing circumstances
where internal parameters are more reliable than market-based ones.
Retirement benefits and other post-employment liabilities are estimated trough an actuarial valuation
performed by an independent expert. Such an evaluation is based on critical judgements because
estimates are made about the likelihood of future events and the actual results could differ
from those estimates.
Estimates that contain elements of uncertainty
The process of applying the IOR’s accounting policies may require the use of key assumptions affecting
the future, and/or other sources of estimation uncertainty as of the balance sheet date, with
a significant risk of causing material adjustments to the carrying amount of assets and liabilities in
the next financial year.
Key assumptions and judgments made in the 2016 Financial Statements relate to the assessment
of illiquid debt securities portfolio held for trading and external investment funds included within
the portfolio held for trading, as disclosed in the section 1.4 “Fair value information”.
Illiquid securities are not quoted in active markets and their fair value is not readily available in the
market.These securities subject estimation uncertainties (Level 3 of fair value hierarchy) amounted
to EUR 23.3m as of 31 December 2016 (2015: EUR 35.9m). These were exclusively comprised
of externally managed investment funds.
With reference to the liabilities related to commitments linked to externally managed investment
funds, they are valued taking into account all available information at the date of preparation of
these financial statements. This assessment is made on the basis of assumptions and the process of
estimation in characterized by elements of uncertainty. By their nature, the estimates and assumptions
used may vary from one period to another and, therefore, it can not be excluded that in subsequent
periods the amounts of such liabilities may differ materially from those currently estimated
as a result of new information and charges in the evaluations made. 40
IOR
Annual report 2016
The IOR has also been working to review and confirm its tax position and that of its clients in countries
where investment relationships exist. This review has identified probable contingencies that
relate to prior years as a result of different interpretations regarding the legal nature of the Institute
and the related applicable tax treatments.
As of 31 December 2016, based on the reviews performed and supported by external legal advisors,
the Institute has estimated a provision of EUR 3.5m, included in the Balance Sheet, item 130
“Provision for risks and charges” line b “Other provisions”. As this represents an estimate based on
critical assumptions, actual results may differ from what is expected when the future event takes
place.
1.1.5 Impact of New Accounting Pronouncements
Accounting standards, amendments and interpretations IFRS effective 1 January 2016
The following accounting standards, amendments and interpretations IFRS were adopted for the
first time by the IOR effective 1 January 2016:
• Amendments to IAS 19 “Defined Benefit Plans: Employee Contributions” (published on 21
November 2013): the amendments relate to the accounting treatment for contributions made
by employees or third parties to a defined benefit plan. The adoption of the amendments had
no impact on the disclosures or the amounts recognized in the Institute’s financial statements.
• Amendments to IFRS 11 “Accounting for acquisitions of interests in joint operations” (published
on 6 May 2014): the amendments provide guidance on how to account for the acquisition
of an interest in a joint operation whose activities constitute a business. The adoption of
the amendments had no impact on the disclosures or the amounts recognized in the Institute’s
financial statements.
• Amendments to IAS 16 and to IAS 38 “Clarification of acceptable methods of depreciation and
amortisation” (published on 12 May 2014):The amendments prohibit the use of revenue-based
depreciation; the revenue generated by an activity that includes the use of the asset to be depreciated
generally reflects factors other than just the consumption of economic benefits of the
asset, which is a requirement for depreciation. The adoption of the amendments had no impact
on the disclosures or the amounts recognized in the Institute’s financial statements.
• Amendment to IAS 1 “Disclosure Initiative” (published on 18 December 2014): the purpose
of the amendment is to provide clarification on disclosure items that may be perceived as presenting
impediments to a clear and intelligible preparation of financial statements. The adoption
of the amendments had no impact on the disclosures or the amounts recognized in the Institute’s
financial statements.
• Amendment to IAS 27 Equity Method in Separate Financial Statements (published on 12 August
2014): the amendment introduces the option to use the equity method in the separate financial
statements of an entity for the valuation of investments in subsidiaries, jointly controlled
entities and associated companies.The adoption of the amendments had no impact on the disclosures
or the amounts recognized in the Institute’s financial statements.
• Amendments to IFRS 10, IFRS 12 e IAS 28 “Investment Entities: Applying the Consolidation
Exception” (published on 18 December 2014): the amendments contain changes relating to
issues that arise from the application of the exception granted to the consolidation of investment
entities. The adoption of the amendments had no impact on the disclosures or the
amounts recognized in the Institute’s financial statements.
Finally, as part of the annual process for the improvement of the accounting standards, dated 12
December 2013 the IASB published the document “Annual Improvements to IFRSs: 2010-2012
Cycle” (including IFRS 2 Share Based Payments – Definition of vesting condition, IFRS 3 Business Com- 41
IOR
Annual report 2016
bination – Accounting for contingent consideration, IFRS 8 Operating segments – Aggregation of operating
segments e Reconciliation of total of the reportable segments’ assets to the entity’s assets, IFRS 13
Fair Value Measurement – Short-term receivables and payables) and in 25 September 2014 the document
“Annual Improvements to IFRSs: 2012-2014 Cycle” (including IFRS 5 – Non-current Assets
Held for Sale and Discontinued Operations, IFRS 7 – Financial Instruments: Disclosure e IAS 19
– Employee Benefits) which partially integrate existing standards. The adoption of the annual improvements
had no impact on the disclosures or the amounts recognized in the Institute’s financial
statements.
Accounting standards, amendments and interpretations IFRS and IFRIC approved by the European
Union, not yet mandatorily applicable and not early adopted by the Institute at 31 December 2016
• Standard IFRS 15 – Revenue from Contracts with Customers (published on 28 May 2014 and
amended on 12th April 2016) will replace the following standards and interpretations: IAS 18
– Revenue IAS 11 – Construction Contracts, IFRIC 13 – Customer Loyalty Programmes, IFRIC
15 – Agreements for the Construction of Real Estate, IFRIC 18 – Transfers of Assets from CustomersSIC
31 – Revenues-Barter Transactions Involving Advertising Services. The standard establishes
a new revenue recognition model, which will apply to all contracts with customers except
those that fall within the scope of other IAS / IFRS standards as leasing, the insurance
contracts and financial instruments.This core principle is delivered in a five-step model framework:
• Identify the contract(s) with a customer;
• Identify the performance obligations in the contract;
• Determine the transaction price;
• Allocate the transaction price to the performance obligations in the contract;
• Recognize revenue when (or as) the entity satisfies a performance obligation.
The standard is effective for annual reporting periods beginning on or after 1 January 2018. Earlier
application is permitted. However, the amendments to IFRS 15, Clarifications to IFRS 15 – Revenue
from Contracts with Customers, published by the IASB on 12 April 2016, are not yet been endorsed
by the European Union. At this stage, the Institute is evaluating the possible impacts of these
changes on the financial statements.
• Final version of IFRS 9 – Financial Instruments (published on 24 July 2014). The document
recognized the results of IASB project to replace IAS 39:
• Introducing new criteria for the classification and measurement of financial assets and liabilities;
• With reference to the impairment model, the new standard requires that the estimate of credit
losses is carried out on the basis of the expected losses model (and not on the incurred losses
model used by IAS 39) using reasonable and supportable information about past events, current
conditions and reasonable and supportable forecasts of future economic conditions;
• Introducing a new hedge accounting model (types of transactions eligible for hedge accounting,
changes in the method of accounting for forward contracts and options when included
in a hedge relationship, changes in the effectiveness test).
The new standard is effective for financial statements beginning on 1 January 2018 or later.
The adoption of the IFRS 9 could have significant impacts on balance sheet income statement and
disclosure. At the same time, for the time being the Institute is not able to provide a reasonable estimation
of the above impacts without carrying out a thorough analysis.
Accounting standards, IFRS amendments and interpretations not yet endorsed by the European Union. 42
IOR
Annual report 2016
At the date of these financial statements, the relevant European Union bodies have not yet completed
the approval process necessary for the adoption of amendments and the principles described
below.
• Standard IFRS 16 – Leases (published on 13 January 2016), will replace the following standards
and interpretations:
• IAS 17 – Leases,
• IFRIC 4 Determining whether an Arrangement contains a Lease,
• SIC-15 Operating Leases – Incentives,
• SIC-27 Evaluating the Substance of Transactions Involving the Legal Form of a Lease.
IFRS 16 establishes principles for the recognition, measurement, presentation and disclosure of
leases, with the objective of ensuring that lessees and lessors provide relevant information that faithfully
represents those transactions.This new standard brings most leases on-balance sheet for lessees
under a single model, eliminating the distinction between operating and finance leases. Lessor accounting
however remains largely unchanged and the distinction between operating and finance
leases is retained. The Institute do not expect a significant impact in the financial statements from
the application of this standard.
• Amendments to IAS 7 “Disclosure Initiative” (published on 29 January 2016).The document
aims to provide some clarification to improve disclosures about financial liabilities. In particular,
the amendments required to provide disclosures that enable users of financial statements
to evaluate changes in liabilities arising from financing activities. The amendments are effective
from 1 January 2017, earlier adoption is permitted. It is not required to present comparative
information relating to prior years.The Institute do not expect a significant impact in the
financial statements from the application of this amendment.
• Document “Applying IFRS 9 Financial Instruments with IFRS 4 Insurance Contracts” (published
on 12 September 2016). For entities whose predominant activity is issuing contracts
within the scope of IFRS 4, the document is intended to clarify the concerns arising from the
application of the new IFRS 9 to financial assets. The Institute do not expect a significant impact
in the financial statements from the application of this document.
• Document “Annual Improvements to IFRSs: 2014-2016 Cycle”, published on 8 December
2016, provides partial integration on existing standards, that include:
• IFRS 1 First-Time Adoption of International Financial Reporting Standards – Deletion of shortterm
exemptions for first-time adopters,
• IAS 28 Investments in Associates and Joint Ventures – Measuring investees at fair value through
profit or loss: an investment-by-investment choice or a consistent policy choice,
• IFRS 12 Disclosure of Interests in Other Entities – Clarification of the scope of the Standard.
The adoption of the above improvement would not affect significantly the Financial Statements.
• Interpretation IFRIC 22 “Foreign Currency Transactions and Advance Consideration” (published
on 8 December 2016). The interpretation clarifies the accounting for transactions that
include the receipt or payment of advance consideration in a foreign currency. This document
provides guidance on how an entity should determine the date of a transaction, and consequently,
the exchange rate to use in circumstances in which consideration is received or paid
in advance of the recognition of the related asset, expense or income. IFRIC 22 is effective from
1 January 2018. Earlier adoption is permitted.
The Institute considers that the application of the above interpretation would not affect significantly
the Financial Statements.
• Amendments to IAS 40 “Transfers of Investment Property” (published on 8 December 2016).
These amendments clarify the transfer of a property to, or from, investment property. In particular,
an entity shall reclassify a property to, or from, investment property only when there 43
IOR
Annual report 2016
is evidence that there has been a change in use of the property. Such a change must be attributed
to a specific event; a change of management’s intentions for the use of a property by itself
does not constitute evidence of a change in use. The amendments are effective from 1 January
2018. Earlier adoption is permitted. The Institute considers that the application of the
above amendments would not affect significantly the Financial Statements.
• Amendments to IFRS 10 e IAS 28 “Sales or Contribution of Assets between an Investor and
its Associate or Joint Venture” (published on 11 September 2014). The amendments address a
conflict between the requirements of IAS 28 ‘Investments in Associates and Joint Ventures’ and
IFRS 10 ‘Consolidated Financial Statements’ and clarify that in a transaction involving an associate
or joint venture the extent of gain or loss recognition depends on whether the assets sold
or contributed constitute a business. At this stage, the IASB suspended the application of these
amendments.
1.2 INFORMATION ON THE MAIN FINANCIAL STATEMENT ITEMS
1.2.1 Financial assets held for trading
A financial asset is classified under this category if acquired principally for the purpose of trading.
Purchases of financial assets held for trading are initially recognized at the transaction date, which
is the date on which the IOR commits to purchasing the asset.
On initial recognition, financial assets held for trading are recognized at fair value, which generally
corresponds to the initial cash consideration paid, excluding direct transaction costs or revenues
directly attributable to the instrument.
Subsequent to initial recognition, the financial assets are measured at fair value, with any gains or
losses arising from the change in fair value recognized in the Income Statement.
Disposals are recognized on the trade date which is the date on which the Institute commits to dispose
the assets.
Gains and losses arising from disposal or redemption and unrealised gains and losses arising from
changes in the fair value are recognized in the Income Statement, item 80 “Net trading result”.
Interest income and expense arising from the financial assets held for trading are recognized in the
Income Statement on an accrual basis and recognized “pro rata” based on the contractual interest
rate. These are recognized in the Income Statement, item 10 “Interest and similar income”.
Dividends on financial assets held for trading are recognized in the Income Statement, item 70 “Dividend
income” when the entity’s right to receive payment is established.
For the fair value measurement please refer to Section 1.4, Fair value information.
All financial assets held for trading are derecognized when the rights to receive cash flows from the
financial assets have expired or when the IOR has substantially transferred all risks and rewards of
ownership.
1.2.2 Financial assets available for sale
Financial Assets classified as Available for sale are those intended to be held for an indefinite period
of time, and those that are subject to agreements that restrict the sale for a specified period. 44
IOR
Annual report 2016
In addition, financial assets classified available for sale include non-derivative financial assets that
are not classified as held for trading or loans and receivables or held to maturity investments.
Financial assets available for sale are initially recognized on the trade date, which is the date on which
the IOR commits to purchasing the asset.
Financial assets available for sale are initially recognized at fair value plus any direct transaction costs.
Financial assets available for sale are subsequently measured at fair value, and any changes in the
fair value are recognized in Other Comprehensive Income and therefore directly in an equity reserve.
Disposals are recognized on the trade date which is the date on which the Institute commits to dispose
the assets.
At the time that the financial assets are derecognized or impaired, accumulated gain or loss from
changes in the fair value of financial assets available for sale previously recognized in Other Comprehensive
Income are reclassified and recognized in the Income Statement. When the financial assets
available for sale are sold, any unrealised gains or losses previously recognized in Other Comprehensive
Income, are reclassified into the Income Statement, item 100 “Profit (loss) on disposal
or repurchase” line b “Financial assets available for sale”. In case of impairment losses, gains or losses
previously recognized in Other Comprehensive Income are transferred to the Income Statement
item 130 “Net losses/reversal on impairment” line b “Financial assets available for sale”.
At each balance sheet date, the IOR assesses whether there is objective evidence of impairment on
financial asset available for sale. A significant or prolonged decline in the fair value of the financial
asset below its cost is considered as objective evidence of a reduction in value. If there is such evidence,
the cumulative loss, measured as the difference between the acquisition cost and the current
fair value, less previously recognized impairment loss, is transferred from equity and recognized in
the Income Statement in item 130 “Net losses/reversal on impairment” line b. If, in a subsequent
period, the amount of the impairment loss decreases, impairment losses recognized in the Income
Statement on equity instruments are not reversed through the Income Statement, but through the
Fair Value Reserves, a component of equity. For debt instruments classified as available for sale, if
the fair value increases in a subsequent period and the increase can be objectively related to an event
occurring after the impairment loss was recognized in profit or loss, the impairment loss is reversed
through the Income Statement.
The impairment policy adopted by IOR is that all equity securities classified as available for sale
must be impaired when their market prices are below their carrying prices and the price decline is
more than 20%, or when the decline to below the acquisition cost has persisted for more than 36
months.
Interest income and expense arising from the financial assets available for sale are recognized in the
Income Statement on an accrual basis and recognized “pro rata” based on the effective interest rate
method. These are recognized in the Income Statement, item 10 “Interest and similar income”.
Dividends on financial assets available for sale are recognized in the Income Statement, item 70 “Dividend
income” when the entity’s right to receive payment is established.
For the fair value measurement please refer to Section 1.4 “Fair value information”.
All financial assets available for sale are derecognized when the rights to receive cash flows from the
financial assets have expired or when the IOR has substantially transferred all risks and rewards of
ownership. 45
IOR
Annual report 2016
1.2.3 Financial assets held to maturity
Financial assets held to maturity investments are quoted non-derivative financial assets with fixed
or determinable payments and with fixed maturities which the IOR has the intention and ability
to hold to maturity. If the IOR sells financial assets held to maturity, the entire category must be
reclassified as available for sale and for two subsequent years, no financial asset can be classified in
this category.
Financial assets held to maturity are initially recognized at the trade date, which is the date on which
the IOR commits to purchasing the asset, and are recognized at fair value plus any direct transaction
costs.
The financial assets held to maturity are subsequently measured at amortised cost using the effective
interest rate method, and adjusted to take into account the effects of any impairment losses,
when applicable the circumstances described below.
Gains and losses on financial assets held to maturity are recognized in the Income Statement through
the financial amortisation process (item 10 “Interest and similar income”) or when the assets are
derecognized (item 100 “Profit (loss) on disposal or repurchase” line c “Financial assets held to maturity”)
or when impairment losses are recognized in the Income Statement (item 130 “Net
losses/reversal on impairment” line c “Financial assets held to maturity”).
As of each balance sheet date, the IOR assesses whether there is objective evidence of impairment
on financial asset held to maturity. A financial asset is impaired and impairment losses are recognized
when one or more loss events occurred after the initial recognition of the asset and that
loss event has an impact on the estimated future cash flows of the financial asset. The amount of
the loss is measured as the difference between the asset’s carrying amount and the present value
of estimated future cash flows discounted at the financial asset’s original effective interest rate. The
carrying amount of the asset is directly reduced and the extent of the loss is recognized in the Income
Statement item 130 “Net losses/reversal on impairment” line c “Financial assets held to maturity”.
Interest income and expense arising from the financial assets held to maturity are recognized in the
Income Statement on an accrual basis and recognized “pro rata” based on the effective interest rate
method. These are recognized in the Income Statement, item 10 “Interest and similar income”.
The effective interest method is a method calculating amortized cost of an asset or a financial liability
and of allocating interest. The effective interest rate is the rate that makes the present value
of expected cash flows until maturity of the financial instrument (or, if more reliable for a shorter
period) exactly equal to the current book value. The calculation not only includes all fees and premiums
or discounts received or paid to the counterparty, which are an integral part of the effective
interest rate, but also the transaction costs and all other premiums or discounts.
All financial assets held to maturity are derecognised when the rights to receive cash flows from the
financial assets have expired or when the IOR has substantially transferred all risks and rewards of
ownership.
1.2.4 Credits
The item includes loans to customers and banks, with fixed or determinable payments, provided
directly, not quoted in an active market and not initially classified as financial assets held for trading,
available for sale or at fair value. 46
IOR
Annual report 2016
The item includes:
1. authorized financing agreements where the Institute provides money directly to the customers
without the intention of subsequent re-negotiation;
2. Loans and Receivables debt securities offered through private placements, which the Institute
does not designate as financial assets at fair value through profit or loss or available for sale.
These financial assets are subject to the risk of deterioration of the creditworthiness of the counterparty.
Financing agreements are recognized when the amount is advanced to the borrower. They are initially
recognized at fair value, which is the value of the loan, plus any direct transaction costs. Financing
agreements are subsequently measured at amortised cost using the effective interest rate
method.
Securities are initially recognized on the trade date, which is the date on which IOR commits to
purchasing the asset at fair value plus any direct transaction costs or income. Securities are subsequently
measured at amortised cost using the effective interest rate method, and are subject to impaired
test and impairment losses are recognized when one or more loss events occurred after the
initial recognition of the asset and that loss event has an impact on the estimated future cash flows
of the financial asset.
When a loan becomes uncollectible, it is written off against the related provision for loan impairment.
Such exposures are written off after all the necessary procedures have been performed and
the extent of the loss has been determined. Subsequent recoveries of amounts previously written
off are recognized in the Income Statement item 130 “Net losses/reversal on impairment” line a “Receivables”.
Interest income and expense arising from loans and advances to customers are recognized in the Income
Statement on an accrual basis and recognized “pro rata” using the effective interest rate method.
These are recognized in the Income Statement, item 10 “Interest and similar income”.
At each balance sheet date, the IOR assesses whether there is objective evidence of impairment. A
financial asset is impaired and impairment losses are recognized when one or more loss events occurred
after the initial recognition of the asset and that loss event has an impact on the estimated
future cash flows of the financial asset.
The amount of the loss is measured as the difference between the asset’s carrying amount and the
present value of estimated future cash flows discounted at the financial asset’s original effective interest
rate. The carrying amount of the asset is reduced through the use of a provision account and
the extent of the loss is recognized in the Income Statement item 130 “Net losses/reversal on impairment”
line a “Receivables”.
Loans which are not individually impaired are subject to valuation on a portfolio basis based on
historical data.The loss is recognized in the Income Statement item 130 “Net losses/reversal on impairment”
line a “Receivables”.
If, in a subsequent period, the impairment loss decreases and the decrease can be objectively attributed
to an event occurring after the impairment was recognized (such as an improvement in the
debtor’s credit rating), the previously recognized impairment loss is reversed by adjusting the allowance
account.The amount of the reversal is recognized in the Income Statement, Statement item
130 “Net losses/reversal on impairment” line a “Receivables”. In any case, the reversal can not exceed
the cost that the financial instrument prior to the recognition of any impairment loss. 47
IOR
Annual report 2016
Credits are derecognized when the rights to receive cash flows from the financial assets have expired
or when the IOR has substantially transferred all risks and rewards of ownership.
Regarding loans to customers, at the end of each month, the Advances Department analyses all exposures
and submits to the Directorate a proposal on how to manage aged loans at risk for noncollection.
Particularly, when the balance is deemed to be collectible within a short period, an impairment
loss is not realized, but the trend is monitored; when the balance is deemed to be
collectible in a mid/long term period, an impairment loss is recognized; when the positions are past
due and uncollectible, the department proposes a write-off the amount as a loss on loans to the Directorate.
It is to be mentioned that the Institute is not authorized by the Autorità di Informazione Finanziaria
to carry out the activity of “lending” (cfr. art. l (l) (b) of the Law n.XVIII and art. 3 (24) (b) of the
Regulation No. l), as credit activities on its own. However, it is authorized to make “advances” that
is to disburse funds to its clients and to a limited extent following guarantee of future income (such
as, for example, in the case of the advance of salary or pension paid by the Holy See or the Governatorato
of Vatican City) or guaranteed by financial assets of the same amount deposited by the
clients at the Institute.
1.2.5 Derivative financial instruments and hedge accounting
Derivatives are initially recognized at fair value on the date in which a derivative contract is entered
into.
The initial fair value generally corresponds to the initial cash consideration, and subsequently remeasured
at fair value with changes recognized through profit or loss.
The fair value of derivatives quoted in active markets is based on current bid prices. If the market
for a financial derivative is not active, the IOR obtains fair value from third parties or establishes
fair value by using valuation models that are primarily based on objective financial inputs, as well
as considering prices utilised in recent transactions and prices of similar financial instruments. All
derivatives are recognized as assets when the fair value is positive and as liabilities when fair value
is negative.
Derivative financial instruments may include embedded derivatives in a hybrid financial instrument.
IAS 39 requires that an embedded derivative be separated from its host contract and accounted for
as a derivative when:
1. The economic risks and characteristics of the embedded derivative are not closely related to
those of the host contract;
2. A separate instrument with the same terms as the embedded derivative would meet the definition
of a derivative;
3. The hybrid (combined) instrument is not measured at fair value with changes in fair value recognized
through Income Statement.
The Institute does not enter into Fair value hedges, Cash flow hedges or Net investment hedges for
foreign currency transactions/positions.
As of 31 December 2016 and 2015, the Institute did not hold derivatives.
48
IOR
Annual report 2016
1.2.6 Investment in subsidiaries
Investment in subsidiariesconsists of the stake in the wholly-owned real estatecompany SGIR, based
in Rome, Via della Conciliazione. The principal assets of this company are real estate properties.
Investment in subsidiaries is carried at cost, less impairment.
Real estate owned by the subsidiary is depreciated on a straight-line basis over its estimated useful
life which management considers as between 30 and 50 years. Land is not depreciated.
1.2.7 Tangible assets
1.2.7.1 Tangible assets for investment – Investment properties
Investment properties are properties directly owned by the IOR. These are buildings not owneroccupied,
but inherited and held to generate rental income, capital appreciation or both.
Investment properties are initially measured at cost (which is zero in case of inheritances) and subsequently
at fair value with any change recognized in the Income Statement, item 220 “Net result
of fair value valuation of tangible and intangible assets”.
Improvements to buildings increase their carrying amounts.
1.2.7.2 Tangible assets for business activities – Equipment, furniture and vehicles
All equipment, furniture and vehicles are stated at historical cost, minus accumulated depreciation.
Historical cost is generally based on the fair value of the sum paid in exchange for assets and includes
expenditure that is directly attributable to the acquisition of the items.
Subsequent costs are included in the asset’s carrying amount or are recognized as a separate asset,
as appropriate, only when it is probable that the IOR will recognise future economic benefits associated
with the item.
All repairs and maintenance costs are charged to the Income Statement in the year they are incurred.
Equipment, furniture and vehicles are amortised on a straight-line basis over their expected useful
lives (four years).
The asset’s residual values and useful lives are reviewed, and adjusted if appropriate, on each balance
sheet date. These assets are reviewed for impairment whenever events or changes in circumstances
indicate that the carrying amount may not be recoverable. An asset’s carrying amount is written
down immediately to its recoverable amount if the asset’s carrying amount is greater than its
estimated recoverable amount.The recoverable amount is the higher of the asset’s fair value less costs
to sell and its value in use.
The result of the impairment test and the depreciations are recognized in the Income Statement
item 170 “Net value adjustments to/recoveries on tangible assets”.
Gains and losses on disposals are determined as the difference between the sale proceeds and the
carrying amount of the assets.They are recognized in the Income Statement, under item 190 “Other
operating income (expense)”.
49
IOR
Annual report 2016
1.2.8 Intangible assets
Intangible assets correspond to computer software licenses and to expenses related to their implementation.
Acquired computer software licenses are recognized at acquisition costs, including costs
incurred to bring the specific software into use. These costs are amortised on a straight-line basis
over their expected useful lives (four years).
These assets are reviewed for impairment whenever events or changes in circumstances indicate that
the carrying amount may not be recoverable. An asset’s carrying amount is written down immediately
to its recoverable amount if the asset’s carrying amount is greater than its estimated recoverable
amount. The recoverable amount is the higher of the asset’s fair value less costs to sell it and
its value in use.
The result of the impairment test and the depreciations are recognized in the Income Statement
item 180 “Net value adjustments to/recoveries on intangible assets”.
Costs associated with maintenance of computer software programmes are recognized as an expense
in the Income Statement when they are incurred.
1.2.9 Due to banks and to customers
Due to banks comprises interim current accounts overdrafts, as the Institute does not carry out funding
activites on the interbank market.
Due to customers are composed by financial instruments (different from trading liabilities) that assumed
the typical forms of funds, realised by IOR with customers.
The mentioned financial liabilities are recorded in the financial statements on the settlement date.
They are initially recognized at the current value, which normally corresponds to the amount collected.The
initial recognition value includes possible expenses and incomes from anticipated transaction
and directly attributable to each liability; not included in the initial carrying amount are all
charges which are paid back by the credit counterparty or that are attributable to internal administrative
expenses.
After the initial recognition, due to banks and to customers are measured at amortized cost using
the effective interest rate method.The short-term liabilities remain recorded at the amount received.
Interest expense related to due to banks and to customers are recognized in the income statement,
item 20 “Interest and similar expense”.
Due to banks and to customers are derecognized when they expired or extinguished.
1.2.10 Legates
According to the Canon Law (Can. 1303), the term “Legati – non autonomous pious foundation”
comprises: “temporal goods given in any way to a public juridical person and carrying with them
a long-term obligation, such a period to be determined by particular law. The obligation is for the
juridical person, from the annual income, to celebrate Masses, or to perform other determined ecclesiastical
functions, or in some other way to fulfil the purposes mentioned in Can. 114, par. 2”.
Based on such definition, this is understood to be an arrangement whereby capital is donated or
willed to the IOR for religious or charitable purposes, based on the understanding that the transferred
capital is invested on a long term basis and the annual income earned from the investment 50
IOR
Annual report 2016
is devoted to the fulfilment of the purpose prescribed by the donor. Under these provisions, the IOR
will administer the capital in accordance with the purpose prescribed by the donor (e.g., for Holy
Mass Intention or scholarships).
Legates are recognised in the financial statement on the settlement date. Legates are initially recognised
at the current value, which normally corresponds to the amount received. The initial recognition
value includes also expenses and incomes for anticipated transaction and directly attributable
to each liability; not included in the initial carrying value are all charges which are paid back
by the credit counterparty or that are attributable to internal administrative expenses.
The interest expense related to the Legates are recognized in the income statement, item 20 “Interest
and similar expense”.
Legates are derecognised when they expired or extinguished.
1.2.11 Staff severance fund
Staff severance fund is a post-employment benefit that correspond to indemnities paid to personnel
when they leave the IOR. The amount due is based on years of service and salary paid in the
last year of employment.These benefits are financed by contributions from employees and the IOR.
The liability is measured with utilizing certain actuarial assumptions, as the present value of the estimated
future cash outflows according to the projected unit credit method required by IAS 19. Remeasurements
arising from the defined benefit plan comprise actuarial gains and losses, recognized
in Other Comprehensive Income. All other expenses related to the defined benefit plan in the Income
Statement, item 150 “Administrative Expenses”, line a “Staff expenses”.
1.2.12 Provisions for risks and charges – Pension fund and similar obligations
For the pensions of its employees, the IOR operates a defined benefit plan, which is financed by
contributions from employees and the IOR.
The IOR’s net liabilities related to the defined benefit plan for pensions is calculated by estimating
the amount of future benefit that employees will earn in return for their service in the current
and prior periods; that benefit is discounted to determine its present value.
The IOR determines the interest expense on the defined benefit liability for the year by applying
the discount rate used to measure the same liability at the beginning of the year.
The discount rate is the yield on the reporting date from high quality corporate bonds that have
maturity dates approximating the terms of the IOR’s liabilities and that are denominated in the currency
in which the benefits are expected to be paid.
The calculation is performed annually by a qualified actuary, who assesses the fairness of the liability,
using the projected unit credit method. Remeasurements arising from the defined benefit plan
comprise actuarial gains and losses. The IOR recognizes them immediately in Other Comprehensive
Income and all other expenses related to the defined benefit plan in the Income Statement, item
150 “Administrative expenses”, line a “Staff expenses”.
When the benefits of the plan are changed, the portion of the changed benefit related to past service
by employees is recognized immediately in the Income Statement.
On 1 January 2005, all IOR personnel also joined the general Vatican City State pension plan.This
system is financed by contributions made by the Institute and employees. Contributions to the Vat- 51
IOR
Annual report 2016
ican plan made by the IOR are recognized in the Income Statement, item 150 “Administrative expenses”,
line a “Staff expenses” when they occur.
Consequently, the IOR’s defined benefit plan for pensions covers the entire amount to be paid by
the Institute to employees for their service up to 31 December 2004. For the employees’ services
from 1 January 2005, the obligation is limited to the part not covered by the Vatican City State
Pension Plan taking into account the difference in the retirement age of the two pension systems.
1.2.13 Foreign Currency Transactions
Functional and presentation currency
The functional currency is the currency in which the items included in the financial statements must
be measured. According to IAS 21 “The effects of changes in foreign exchange rates” the functional
currency is the currency of the primary economic environment in which the entity operates. This
is the currency that determines the pricing of transactions, but it is not necessarily the currency in
which transactions are denominated.
The reporting currency is the currency in which the financial statements are prepared. IAS 21 allows
an entity to prepare its financial statements in any currency.
The IOR’s functional and presentational currency is the Euro, which is the currency of the primary
economic environment in which the Institute operates.
Transactions and balances
Foreign currency transactions, if they impact profit or loss accounts, are converted into the functional
currency using the exchange rates applicable at the date of the transaction.
Monetary assets and liabilities denominated in foreign currencies are converted into the functional
currency using the spot exchange rate at the reporting date (closing rate).
Non-monetary assets and liabilities denominated in foreign currencies are translated using the rate
at the date their amount (cost or fair value) was determined.
Non-monetary items carried at cost are converted at the exchange rate at the date of initial recognition
in the financial statements.
Non-monetary items carried at fair value are translated using the rate at the date of the determination
of their fair value.
Foreign exchange gains and losses resulting from the settlement of foreign currency transactions and
from the conversion at year-end exchange rates of monetary assets and liabilities denominated in
foreign currencies are recognized in the Income Statement, item 80 “Net income for trading activities”.
Foreign exchange gains and losses resulting from the conversion at year-end exchange rates of nonmonetary
assets and liabilities are:
• recognized in the Income Statement as part of the fair value gain or loss if the non-monetary
assets and liabilities are carried at fair value through profit and loss;
• included in the fair value reserves in the equity if the non-monetary assets and liabilities are car- 52 ried at fair value in the equity.
IOR
Annual report 2016
1.2.14 Offsetting financial instruments
Financial assets and liabilities are offset and the net amount is reported on the Balance Sheet only
when there is a legally enforceable right to offset the recognized amounts and there is an intention
to settle on a net basis. Otherwise, the financial assets and liabilities are separately reported on the
balance sheet.
1.3 TRANSFERS BETWEEN PORTFOLIOS
The amendments to IAS 39 and to IFRS 7 “Reclassification of financial assets” allow for the reclassification
of certain financial assets after their initial recognition, out of the held for trading
(HFT) and available for sale (AFS) portfolios.
In particular, those HFT or AFS financial assets that would have met the definition specified by
international accounting standards for the loan portfolio (if such assets were not classified as HFT
or AFS respectively on initial recognition) may be reclassified if the entity intends, and is able, to
hold them for the foreseeable future or until maturity.
The Institute did not have any transfers between portfolios in 2016 and in previous years.
1.4 FAIR VALUE INFORMATION
1.4.1 Qualitative fair value information
For the measurement of fair value, the amendments to IFRS 7 and subsequent changes introduced
by IFRS 13 defines a fair value hierarchy based on level of observable inputs, valuation techniques
adopted and parameters used for measurement. The financial assets are classified according to the
following hierarchy that consists of three levels.
Level 1
In Level 1, the fair value is measured using the quoted prices in active markets for the financial assets
and liabilities to be evaluated.
A financial instrument is considered quoted in an active market when its price is:
• readily and regularly available on stock exchanges, from information providers or intermediaries;
• significant, meaning that it represents effective market transactions regularly occurring in normal
transactions.
To be considered Level 1, the price should be not be adjusted through an adjustment factors (valuation
adjustment). If it is adjusted, the measurement at fair value of financial instrument will be
Level 2 or Level 3.
Level 2
A financial instrument is included in Level 2 when the inputs utilised to measure fair value are directly
or indirectly observable in the market.
The parameters of Level 2 are as follows:
• prices quoted on active markets for similar assets or liabilities;
• price quoted on non-active markets for similar or identical assets and liabilities; 53
IOR
Annual report 2016
• market observable inputs other than the quoted price for the asset or liability (interest rates,
yield curve, credit spreads, volatility);
• parameters that derive mainly (or are corroborated by correlation or other techniques) from observable
market data (market-corroborated inputs).
An input is observable when it reflects the assumptions that market participants would use in pricing
an asset or liability based on market data provided by sources independent of the reporting entity.
Valuation techniques used to determine fair value that should be used when the market price is not
available or is not significant, must meet three conditions. They must:
1. be methodologically consolidated and widely accepted;
2. utilise market inputs disclosed above;
3. be periodically reviewed.
Valuation techniques used for fair value measurement should be periodically assessed using inputs
observable in the markets to ensure that outputs reflect actual data and comparative market prices
and to identify any weaknesses.
If the fair value measurement utilise observable inputs that require a significant adjustment based
on unobservable inputs, the financial instrument should be considered in Level 3.
Level 3
Included in Level 3 are financial instruments valued using inputs unobservable market data (unobservable
inputs). To be included in Level 3, at least one of the inputs must be unobservable on
the market.
Level 3 financial instruments are valued using inputs are not derived from independent sources but
on the reporting entity’s own assumptions based on assumptions that market participants would
use, based on observable inputs.
IFRS 13 specifies a hierarchy of fair value measurements based on whether the inputs are observable
or unobservable. Observable inputs reflect the assumptions that market participants would use
in pricing the asset or liability based on market data obtained from sources independent of the reporting
entity. The market price is the most observable and objective input (Level 1). Where no
active markets exists or where quoted prices are not available, the entity determines the fair values
by using valuation techniques. Valuation techniques can utilise inputs observable on the market
(Level 2) or non-observable inputs (Level 3).
The above mentioned valuation approaches should be applied in a hierarchical order.
When there is availability of quoted market prices in active markets, an entity must measure fair
value using Level 1 inputs. Furthermore, the valuation techniques used should prioritise the utilization
of inputs observable on the market and should rely as little as possible on the reporting entity’s
own data, internal valuations or unobservable inputs.
Fair value level 2 and 3: valuation techniques and input used
The criteria used by the IOR to determine the fair value of financial instruments are as follows.
The fair values of investments held by the IOR quoted in active markets are usually based on current
bid prices.
A financial instrument is considered as quoted in active markets if the prices are readily and regu- 54
IOR
Annual report 2016
larly available in an exchange or regulatory agency and those prices represent actual market transactions
that occur regularly on an arm’s length basis.
In the absence of an active market, or in the event the market at the time of the valuation is not
considered active, for example, in case of illiquid markets, the valuation techniques adopted by IOR
are based on the use of recent arm’s length transactions in the market, even on a non-active market,
relative to identical financial instrument or financial instruments with similar characteristics.
The valuation techniques include the discounted cash flow analysis and other valuation techniques
commonly used by market participants.
If recent transactions of the same or similar instruments are not available, the IOR uses valuation
techniques based on market parameters or other parameters.
When using valuation techniques, the IOR tries to use observable market data, reducing its reliance
on internal data.
Valuation techniques are periodically reviewed for applicability, assessing the quantity and the quality
of information available as of the balance sheet date, in order to correctly reflect any changes in
the market. For the same reason, adjustments to market inputs, utilised in a certain model, can
change from time to time.
Consequently IOR models ensure that outputs reflect actual data and comparative market prices.
In Level 1, the IOR has classified all financial instruments quoted in active markets.
Under Level 2, the IOR has classified all illiquid financial instruments, include those that are structured
or unstructured, as well as listed external investment funds that are not immediately payable
and unlisted investment funds with investments in listed instruments. The basis for the valuation
of illiquid securities follow prices provided by the securities issuer. These prices are internally verified
and tested utilising internal models and observable market parameters and, in case of discrepancies,
adjusted considering the result of the above-mentioned analysis. They are also adjusted on
the basis of valuations from independent sources.
Under Level 3, the IOR has classified equity securities that are not quoted or other financial instruments
for which fair values are determined using a model based on internal parameters.
To the extent that this is practical, the models use only observable data. However, areas such as default
rates, volatilities and correlations require the Directorate to make estimates.
In this category the Institute has also classified other assets:
• for which the IOR did not receive independent valuations;
• for which the IOR does not have access to financial information;
• for which, despite having financial information, the Institute believes that the valuation of underlying
assets, due to the nature of the investment, is based on valuation parameters that are
not immediately observable in the market;
• for which the IOR has received independent expert valuations (i.e. for investment properties).
The NAV of funds, defined as the difference between the current value of the assets and liabilities
of the fund, a Fair Value Adjustment was calculated to include other risk factors.
The Fair Value Adjustment (FVA) is defined as the amount to be added to the mid-price observed
in markets, rather than the price determined by the model, with the aim of obtaining the fair value
of the position. The FVA includes the uncertainty inherent in the valuation of a financial instrument
with the goal of reducing the risk of incorrect valuations in the financial statements and en- 55
IOR
Annual report 2016
suring that fair value reflects the realised price of a market transaction that is actually possible; and
incorporating possible future costs.
The Institute adjusts the value of financial instruments measured at fair value on a recurring basis
classified as Level 2 and Level 3 based on credit risk (Credit Valuation Adjustment), liquidity risk
related to the disinvestment, close-out costs and available informations about the outstanding assets.
With regard to the Credit Valuation Adjustment, the Institute considered the impact of fair value
on credit risk of the counterparty and the country using the following inputs:
• PD (Probability of Default) linked to the rating of counterparty (if not available the PD corresponding
to an investment with an S&P rating of BBB was used);
• LGD (Loss Given Default) based on the estimated level of expected recovery in case of counterparty
default and defined through market benchmark and based on experience.The percentage
used was 60%.
Regarding the close-out cost, an adjustment is applied on the NAV of external investment funds
if close-out penalties are stipulated.
Sensitivity Analysis
For fair value measurements where significant unobservable inputs are used (level 3), a sensitivity
analysis is performed in order to obtain the range of reasonable alternative valuations. The Institute
takes into account that the impact of unobservable inputs on the measurement of fair value
of Level 3 depends on the correlation between the different inputs used in the valuation process.
A sensitivity analysis was performed using a stress test on the PD and LGD by +/-5% and it did
not have a significant impact to the value of the investments classified as Level 3.
Fair value hierarchy (transfers between portfolios)
With reference to financial assets and liabilities measured at fair value on a recurring basis, transfers
between the fair value hierarchy were based on the following guidelines.
For debt securities, transfers from level 3 to level 2 occurs when the relevant parameters used as inputs
to the valuation technique are observable on the market. Transfers from level 3 to level 1 occurs
when the presence of an active market has been verified, as defined by IFRS 13.Transfers from
level 2 to level 3 occurs when some of the relevant parameters for determination of fair value are
no longer directly observable on the market.
For equity instruments classified as available- for- sale, transfers between the fair value hierarchy occurs:
• during the period, when market observable inputs become available (e.g. prices are determined
in comparable transactions on the same instrument between independent and knowledgeable
counterparties), the Institute proceeds with the reclassification from level 3 to level 2;
• when inputs that are directly or indirectly observable in the market used as the basis for the valuation
no longer exist, or no longer updated (e.g. No recent comparable transactions or market
multiples are no longer applicable) and no other inputs are available, the Institute uses valuation
techniques that use unobservable inputs.
Information on assets measured at fair value on a recurring basis
We provide below the IFRS 13 disclosure requirements about assets measured at fair value on a recurring
basis. By definition, the carrying value of these items corresponds to the fair value. 56
IOR
Annual report 2016
Fair value is defined as the price that would be received in selling an asset or paid when transferring
a liability in an ordinary transaction between market participants at the measurement date (i.e.
an exit price).
Financial assets held for trading
These consist of:
• Debt securities: the Institute has investments in debt securities valued at market price (markto-market)
and regularly traded in active, liquid markets. Consequently, these instruments are
classified as Level 1 in the fair value hierarchy, except for some bonds whose prices are determined
internally on the basis of similar instruments quoted on active markets and are classified
as Level 2; these amounted to EUR 81.5m.
• Equity securities: the Institute has investments in equity securities valued at market price (markto-market)
and regularly traded in active, liquid markets. Consequently, these instruments classified
as Level 1 in the fair value hierarchy.
• Investments funds: the Institute has external investment funds amounting to EUR 33.7m. With
the exception of a fund of EUR 10.4m as Level 2 (liquid with monthly NAV), investment funds
are classified as Level 3. Consequently, at 31 December 2016, a total of EUR 10.4m was classified
as Level 2, while the remaining amount for EUR 23.3m was Level 3.
Financial assets available for sale
These are mainly classified as Level 1, comprise of shares quoted in active, liquid markets, except
for two unlisted equity securities, one classified as Level 2 and the other classified as Level 3.
Tangible assets for investment
This item is comprised of properties directly owned by the Institute.
The fair value of the properties is assessed by a qualified, independent expert.
The appraisal is based on the real estate market data collected through surveys carried out by major
industry players. The parameters used also reflect expert assumptions based on available information.
For these reasons, the investment properties are classified as Level 3 on the fair value hierarchy.
Assets not measured at fair value on a recurring basis
For assets and liabilities not measured at fair value on a recurring basis, the following is the information
is required by IFRS 13.
Financial assets held to maturity
The fair value of financial assets held to maturity securities corresponds to the market value at the
balance sheet date. The securities are classified as Level 1 in the fair value hierarchy since they are
regularly traded on active, liquid markets.
Due from banks
This item is comprised of deposits on demand and time deposits with banks in addition to financial
“Loans and Receivables” securities issued by banks.
Assuming that time deposits do not exceed ninety days, the carrying value of bank deposits, at the
balance sheet date, approximates fair value and they are recorded in Level 1 of the fair value hierarchy.
For “Loans and Receivables” securities, the fair value represents the market value at the closing date
of the financial statements. 57
IOR
Annual report 2016
By definition, “Loans and Receivables” securities are not quoted in active, liquid markets, but the
valuation is sent weekly by the counterparty and is verified through an internal model.
For these reasons, “Loans and Receivables” securities are classified in Level 2 of the fair value hierarchy.
Due from customers
This item is comprised of receivables due from credits granted as advances to clients in addition to
“Loans and receivables” securities issued from entities other than banks.
For Doubtful loans considered to be non-collectible, the Institute proceeded in the calculation of
a specific impairment loss, and the carrying value represents fair value.
With regards to other receivables, the fair value was calculated as follows:
• Loans and credit lines: calculated by discounting future cash flows using a discount rate representative
rate for the Institute;
• Overdrafts: given their nature, the value of overdrafts approximates fair value.
For “Loans and Receivables” securities the fair value represents the market value at the closing date
of the financial statements.
By their nature, “Loans and Receivables” securities are not quoted in active, liquid markets, but the
valuation is sent weekly by the counterparty and is controlled through an internal model.
For these reasons, “Loans and Receivables” securities are classified in Level 2 of the fair value hierarchy.
Liabilities not measured at fair value on a recurring basis
Due to banks
The carrying value of this item approximates fair value, considering their short maturity.
Due to customers
This item is comprised of client deposits on demand and time deposits, liquid accounts and term
deposits related to Asset Management positions. Their carrying value approximates fair value, considering
the short maturity.
As the fair value calculation is based on parameters not observable on markets, not even indirectly,
these are classified as Level 3 in the fair value hierarchy.
58
IOR
Annual report 2016
1.4.2 Quantitative fair value information
1.4.2.1 Fair value hierarchy
(a) Assets and liabilities measured at fair value on a recurring basis: detail by fair value level
2016 2015
L1 L2 L3 L1 L2 L3
1. Financial assets held for trading 1,802,904 91,923 23,277 1,499,512 132,512 35,942
2. Financial assets carried
at fair value
3. Financial assets available for sale 6,157 499 8 13,348 1,811 8
4. Hedging derivatives
5. Tangible assets 2,980 2,897
6. Intangible assets
Total 1,809,061 92,422 26,265 1,512,860 134,323 38,847
1. Financial liabilities held
for trading
2. Financial liabilities carried
at fair value
3. Hedging derivatives
Total
Key: L1 = Level 1 L2 = Level 2 L3 = Level 3
(b) Annual changes of assets measured at fair value on a recurring basis (Level 3)
The following table provides information about the assets measured at fair value on a recurring basis
and categorized as Level 3 in the fair value hierarchy at the beginning of the year, disposals and/or
additions during the year, and their final values at the balance sheet date.
Financial assets Financial assets Tangible
held for available assets
trading for sale
1. Opening balance 35,942 8 2,897
2. Additions
2.1 Purchases
2.2 Profit recognized in:
2.2.1 Income Statement 1,693 136
– of which Gains 1,693 136
2.2.2 Net Equity
2.3 Transfers from other levels
2.4 Other variations in addition
3. Disposals
3.1 Sales
3.2 Reimbursement
3.3 Losses recognized in:
3.3.1 Income Statement (14,358) (53)
– of which Losses (14,358) (53)
3.3.2 Net Equity
3.4 Transfers to other levels
3.5 Other variations in reduction
4. Closing balance 23,277 8 2,980
59
IOR
Annual report 2016
(c) Annual changes of liabilities measured at fair value on a recurring basis (Level 3)
The Institute did not hold liabilities measured at fair value on a recurring basis.
d) Assets and liabilities not measured at fair value or measured at fair value on a non-recurring basis:
detail by fair value level
2016 2015
BV L1 L2 L3 BV L1 L2 L3
1. Financial assets
held
to maturity 558,956 583,392 614,818 650,020
2. Due from banks 643,229 643,229 644,089 618,660 25,330
3. Due from
customers 29,153 30,418 86,234 62,116 25,374
Total 1,231,338 1,226,621 30,418 1,345,141 1,268,680 87,446 25,374
1. Due to banks 10,597 10,597
2. Due to
customers 2,398,924 2,398,924 2,323,403 2,323,403
Total 2,398,924 2,398,924 2,334,000 10,597 2,323,403
Key: BV = Book Value L1 = Level 1 L2 = Level 2 L3 = Level 3
1.5 INFORMATION ON “DAY ONE PROFIT/LOSS”
The Institute did not earn day one profit/loss from financial instruments pursuant to paragraph 28
of IFRS 7 and other related IAS/IFRS paragraphs.
60
IOR
Annual report 2016
PART 2. INFORMATION ON THE BALANCE SHEET
ASSETS
ITEM 10 – CASH AND CASH EQUIVALENTS
Detail
2016 2015
(a) Cash 15,216 16,213
(b) Free deposits ex art. 9 (b) 35,634 98,524
(c) Free deposits ex art. 9 (c)
(d) Other free deposits
Total 50,850 114,737
The balance included in (b) represent free deposits with Public Authorities of the Holy See and Vatican
City State with the statutory purpose of administering the assets owned by the Holy See (at
present APSA).
ITEM 20 ASSETS – FINANCIAL ASSETS HELD FOR TRADING
2.1 Detail by asset type
2016 2015
L1 L2 L3 L1 L2 L3
A. Cash assets
1. Debt securities
1.1 Structured securities
1.2 Other debt securities 1,750,174 81,519 1,436,403 127,125
2. Equity securities 52,730 63,109
3. UCI units 10,404 23,277 5,387 35,942
4. Loans
4.1 Outstanding repos
4.2 Other
Total A 1,802,904 91,923 23,277 1,499,512 132,512 35,942
B. Derivatives
1. Financial derivatives
1.1 Held for trading
1.2 Related to the
fair value option
1.3 Other
2. Credit derivatives
2.1 Held for trading
2.2 Related to the
fair value option
2.3 Other
Total B
Total (A+B) 1,802,904 91,923 23,277 1,499,512 132,512 35,942
The table shows all financial assets, by type, allocated to the trading portfolio and classified in the
fair value hierarchy (L1, L2 or L3) according to their nature.
Financial assets held for trading is primarily comprised of debt securities classified as level 1 in the 61
IOR
Annual report 2016
fair value hierarchy; the only financial assets classified as level 3 are shares of UCI units.
As of 31 December 2016, similar to the prior year, the Institute did not have any derivative financial
instruments in the trading portfolio.
2.2 Detail by borrowers/issuers
2016 2015
A. Cash assets
1. Debt securities
(a) Public entities 912,466 546,426
(b) Financial companies 703,239 705,268
(c) Insurance companies 9,286 21,217
(d) Non financial companies 206,702 290,617
(e) Other subjects
2. Equity securities
(a) Banks
(b) Other issuers:
– insurance companies 2,759 1,074
– financial companies 36,529 57,654
– non financial companies 13,442 4,381
– other
3. UCI units 33,681 41,329
4. Loans
(a) Public entities
(b) Financial companies
(c) Insurance companies
(d) Non financial companies
(e) Other subjects
Total A 1,918,104 1,667,966
B. Derivatives
(a) Banks
(b) Customers
Total B
Total (A+B) 1,918,104 1,667,966
UCI units in the financial assets held for trading refers exclusively to investment funds managed
by third parties composed by equity securities. Regarding the composition of the funds, refer to the
table included in section 5.2.6 “Information on unconsolidated structured entities” of Part 5 “Information
on risks and hedging policies”.
No borrowers/issuers are residents of the Vatican City State.
Line (a) Public entities of the item A.1 Debt securities is exclusively comprised of securities issued
by Foreign Central Public Administrations.
In the portfolio of financial assets held for trading there are no equity securities classified as in default
or at the risk of default.
62
IOR
Annual report 2016
ITEM 40 ASSETS – FINANCIAL ASSETS AVAILABLE FOR SALE
4.1 Detail by asset type
2016 2015
L1 L2 L3 L1 L2 L3
1. Debt securities
1.1 Structured securities
1.2 Other debt securities
2. Equity securities
2.1 Carried at fair value 6,157 499 13,348 1,811
2.2 Carried at cost 8 8
3. UCI units
4. Loans
Total 6,157 499 8 13,348 1,811 8
4.2 Detail by borrowers/issuers
2016 2015
A. Cash assets
1. Debt securities
(a) Public entities
(b) Financial companies
(c) Insurance companies
(d) Non financial companies
(e) Other subjects
2. Equity securities
(a) Banks
(b) Other issuers:
– insurance companies 6,157 13,348
– financial companies
– non financial companies 507 1,819
– other
3. UCI units
4. Loans
(a) Public entities
(b) Financial companies
(c) Insurance companies
(d) Non financial companies
(e) Other subjects
Total A 6,664 15,167
No borrowers/issuers are resident in the Vatican City State.
In the portfolio of financial assets available for sale, there are no equity securities classified in default
or at the risk of default.
4.3 Financial assets available for sale with specific hedges
The Institute did not hold financial assets available for sale with specific hedges.
63
IOR
Annual report 2016
ITEM 50 ASSETS – FINANCIAL ASSETS HELD TO MATURITY
5.1 Detail by asset type
2016 2015
FV FV
BV
L1 L2 L3
BV
L1 L2 L3
1. Debt securities
– structured
– other 558,956 583,392 614,818 650,020
2. Loans
Total 558,956 583,392 614,818 650,020
Key: BV = book value, FV = fair value
Financial assets held to maturity is mainly comprised of government bonds issued by European countries
and bonds issued by international financial entities.
As of 31 December 2016, securities with maturity less than 1 year (31 December 2017) had a balance
sheet value amounting to EUR 316.4m.
5.2 Detail by borrowers/issuers
2016 2015
1. Debt securities
(a) Public entities 441,580 518,262
(b) Financial companies 88,033 66,998
(c) Insurance companies
(d) Non financial companies 29,343 29,558
(e) Other subjects
2. Loans
(a) Public entities
(b) Financial companies
(c) Insurance companies
(d) Non financial companies
(e) Other subjects
Total 558,956 614,818
No borrowers/issuers are residents of the Vatican City State.
Line (a) Public entities of the item A.1 Debt securities is exclusively comprised of securities issued
by Foreign Central Public Administrations.
5.3 Financial assets held to maturity with specific hedges
The Institute did not hold financial assets held to maturity with specific hedges.
64
IOR
Annual report 2016
ITEM 60 ASSETS – DUE FROM BANKS
6.1 Detail by type
2016 2015
FV FV
BV
L1 L2 L3
BV
L1 L2 L3
A. Credits ex art. 14 (c)
1. Fixed-term deposits 77,104 77,104 60,707 60,707
2. Outstanding repos
3. Others
B. Credits ex art. 14 (d)
1. Fixedterm deposits
2. Outstanding repos
3. Others
C. Due from banks
1. Loans
1.1 Current accounts
and demand
deposits 457,624 457,624 265,426 265,426
1.2 Outstanding
repos 108,501 108,501 292,527 292,527
1.3 Other loans:
(a) Outstanding repos
(b) Finance lease
(c) Other
2. Debt securities
2.1 Structured
securities
2.2 Other debt
securities 25,429 25,330
Total 643,229 643,229 644,089 618,660 25,330
Key: BV = book value, FV = fair value
No assets impairment was recorded.
Line A. Credits ex art. 14 (c) is comprised of different deposits from free deposits held with the Public
Authorities of the Holy See and Vatican City State with the statutory purpose of administering
the assets owned by the Holy See (at present, APSA).
6.2 Credits with specific hedges
The Institute did not hold credits with specific hedges and it has not outstanding finance leases.
65
IOR
Annual report 2016
ITEM 70 ASSETS – DUE FROM CUSTOMERS
7.1 Detail by type
2016 2015
Book value Fair value Book value Fair value
Impaired Impaired Non
Purch- Other L1 L2 L3
Non
Purch- Other L1 L2 L3 impaired
ased
impaired
ased
A. Loans
1. Current accounts 8,424 27 8,451 518 53 570
2, Outstanding repos
3. Mortgages
4. Credit cards,
personal loans and
loans on salary
5. Finance lease
6. Factoring
7. Other loans 12,495 8,207 21,967 13,416 9,944 24,804
B. Debt securities
1. Structured securities
2. Other debt securities 62,303 62,116
Total 20,919 8,234 30,418 76,237 9,997 62,116 25,374
Additional supporting information is provided in Part 5 “Information on risks and related hedging
policies” of this document.
It is to be mentioned that the Institute is not authorized by the Autorità di Informazione Finanziaria
to carry out the activity of “lending” (cfr. art. l (l) (b) of the Law n. XVIII and art. 3 (24) (b) of
the Regulation No. l), as credit activities on its own. However, it is authorized to make “advances”
that is to disburse funds to its clients and to a limited extent following guarantee of future income
(such as, for example, in the case of the advance of salary or pension paid by the Holy See or the
Governatorato of Vatican City) or guaranteed by financial assets of the same amount deposited by
the clients at the Institute.
7.2 Detail by borrowers
2016 2015
N Impaired Impaired on Non
impaired Purchased Other impaired Purchased Other
1. Debt securities
(a) Public Entities
(b) Financial companies 52,304
(c) Insurance companies 10,000
(d) Non financial companies
(e) Other subjects
2. Loans to:
(a) Public Entities 8,290
(b) Financial companies
(c) Insurance companies
(d) Non financial companies 3,315 3,510
(e) Other subjects 9,314 8,234 10,423 9,997
Total 20,919 8,234 76,237 9,997
66
IOR
Annual report 2016
7.3 Credits with specific hedges
The Institute did not hold credits with specific hedges.
ITEM 100 ASSETS – INVESTMENT IN SUBSIDIARIES
10.1 Information on investment in subsidiaries
The Institute holds a financial investment in a real estate company, SGIR S.r.l., which is based in
Italy and is 100% owned by the IOR.
10.2 Material investments in subsidiaries: book value, fair value and dividends received
The value of the investment in the real estate company SGIR S.r.l. was EUR 15.8 m.
There was no change in the value of the investment during 2016 and no dividends were paid.
The equity of SGIR S.r.l. as of 31 December 2016 was EUR 22.6m (2015: EUR 22.1m), including
EUR 12.4m (2015: EUR 12.4m) for a Fiscal Revaluation Reserve.
Being the investment in an unlisted company, IOR has not carried out the measurement of the fair
value.
10.3 Material investment in subsidiaries: financial information
A. Subsidiaries
entities
SGIR S.r.l. 262 596 25,783 3,975 100 1,687 -1 8 869 443 443 443
B. Entities
subject to
joint control
C. Entities
subject to
significant
influence
67
IOR
Annual report 2016
Compreh
ensive
income
(3) = (1)
+ (2)
Other
income
items
after taxes
(2)
Profit
(loss)
for the
year (1)
Profit
(loss)
from
groups of
assets
being
disposed
after taxes
Profit
(loss)
from
current
operations
after taxes
Profit
(loss)
from
current
operations
before
taxes
Value
adjustmen
ts and
writebacks
on
tangible
and
intangible
assets
Financial
assets
Non
financial
assets
Financial
liabilities
Non
financial
liabilities
Total
income
Interest
margin
Cash and
cash
equivalents
ITEM 110 ASSETS -TANGIBLE ASSETS
11.1 Tangible assets in-use: detail of the assets measured at cost
2016 2015
1. Owned assets
(a) land
(b) buildings
(c) furniture 1 14
(d) electronic equipment 115 59
(e) other 11
2. Assets acquired under finance lease
(a) land
(b) buildings
(c) furniture
(d) electronic equipment
(e) other
Total 116 84
11.4 Tangible assets held for investment: detail of the assets measured at fair value
2016 2015
FV FV
BV
L1 L2 L3
BV
L1 L2 L3
1. Owned assets
(a) land
(b) buildings 2,980 2,980 2,897 2,897
2. Assets acquired
under finance lease
(a) land
(b) buildings
Total 2,980 2,980 2,897 2,897
Key: BV = book value, FV = fair value
68
IOR
Annual report 2016
11.5 Tangible assets in- use: annual changes
Land Buildings Furniture Electronic Other Total
equipment
A. Opening balance 2,628 4,335 32 6,995
A.1 Net total adjustments (2,614) (4,276) (21) (6,911)
A.2 Net opening balance 14 59 11 84
B. Increases:
B.1 Purchases 1 113 114
B.2 Capitalised improvement costs
B.3 Write-backs
B.4 Positive fair value differences
recognized in
a) Net Equity
b) Income Statement
B.5 Positive foreign exchange differences
B.6 Transfer from investment property
B.7 Other changes
C. Decreases:
C.1 Sales
C.2 Depreciation (14) (57) (11) (82)
C.3 Impairment losses recognized in:
a) Net Equity
b) Income Statement
C.4 Negative fair value differences
recognized in
a) Net Equity
b) Income Statement
C.5 Negative foreign exchange differences
C.6 Transfer to:
a) investment property
b) assets being disposed
C.7 Other changes
D. Net closing balance 2,629 4,448 32 7,109
D.1 Total net adjustments (2,628) (4,333) (32) (6,993)
D.2 Gross closing balance 1 115 116
All tangible assets in-use were measured at cost.
69
IOR
Annual report 2016
11.6 Tangible assets held for investment: annual changes
Total
Land Buildings
A. Opening balance 2,897
B. Increases:
B.1 Purchases
B.2 Capitalised improvement costs
B.3 Positive fair value differences 136
B.4 Write-backs
B.5 Positive foreign exchange differences
B.6 Transfer from tangible assets for functional use
B.7 Other changes
C. Decreases
C.1 Sales
C.2 Depreciation (53)
C.3 Negative fair value differences
C.4 Impairment losses
C.5 Negative foreign exchange differences
C.6 Transfer to other assets
a) tangible assets for functional use
b) current assets being disposed
C.7 Other changes
D. Closing balance 2,980
All the tangible assets held for investment are measured at fair value.
The item incudes 5 investment properties received in the past through donations, totaling EUR
3.0m. The item increased from 31 December 2015 due to an increase in fair values.
The Institute has surveys performed by a qualified independent expert.
As of 31 December 2016, the properties did not generate any rental income. In October 2015, the
Institute signed a lease agreement with its subsidiary SGIR for the use of four properties for free.
In 2016 SGIR did not receive rental income on these properties.
In relation to the fifth property, please note that during the month of December 2016 the IOR took
the full ownership. At the same time the Institute has not yet the property of the real estate, due
to the completion of some formalities related to the inheritance.
70
IOR
Annual report 2016
ITEM 120 ASSETS – INTANGIBLE ASSETS
12.1. Detail by asset
2016 2015
Definite Indefinite Definite Indefinite
life life life life
A.1. Goodwill
A.2. Other intangible assets
A.2.1 Assets carried at cost:
(a) intangible assets generated internally
(b) other assets 1,044 875
A.2.2 Assets carried at fair value
(a) intangible assets generated internally
(b) other assets
Total 1,044 875
Intangible assets consist of software programs and cost incurred to implement them.
12.2 Annual changes
Other intangible assets Other intangible
generated internally assets: other
Goodwill DEF INDEF DEF INDEF Total
A. Opening balance 6,229 6,229
A.1 Total net adjustments (5,354) (5,354)
A.2 Net opening balance 875 875
B. Increases
B.1 Purchases 852 852
B.2 Increases of intangible
assets generated internally
B.3 Write-backs
B.4 Positive fair value differences
recognized in
– Net Equity
– Income Statement
B.5 Positive foreign exchange differences
B.6 Other changes
C. Decreases
C.1 Sales
C.2 Impairment losses
– Depreciation (683) (683)
– Write downs recognized in
+ Net Equity
+ Income Statement
C.3 Negative fair value differences
recognized in
– Net Equity
– Income Statement
C.4 Transfer to non-current assets
being disposed
C.5 Negative foreign exchange differences
C.6 Other changes
D. Net closing balance 7,081 7,081
D.1 Total net adjustments (6,037) (6,037)
E. Gross closing balance 1,044 1,044 71
IOR
Annual report 2016
Intangible assets are carried at cost.
The IOR does not have internally generated intangible assets.
ITEM 150 ASSETS – OTHER ASSETS
15. Other Assets
2016 2015
1.Gold 22,394 22,766
2. Medals and precious coins 10,490 10,437
3. Securities sold not settled
4. Sundry debtors 8,095 7,553
5. Prepayments 980 801
Total 41,959 41,557
Gold is mainly deposited with the U.S. Federal Reserve, while medals and precious coins are kept
in the IOR vaults.
Gold is carried at the lower of cost and net estimated recoverable amount.
Medals and precious coins are appraised on the basis of their weight and the quality of gold and
silver they contain, carried at the lower of cost and net estimated recoverable amount.
For further information regarding the accounting policies adopted, their impacts and their evaluation,
please refer to Part. 1 “Accounting policies” Section 1.1.4 “Other aspects” in these financial
statements.
Also included in Other Assets is Sundry debtors, for EUR 6.5m, representing commission from asset
management services not yet received at the closing date of the financial statements.These commissions,
pertaining to the second half of 2016, were collected at the beginning of 2017.
Furthermore, other assets include prepayments, which is comprised of EUR 799,000 deposited as
guarantees for credit cards transactions and EUR 160,000 in advances for credit cards transactions.
72
IOR
Annual report 2016
LIABILITIES
ITEM 10 LIABILITIES – DUE TO BANKS
1.1 Detail by product
2016 2015
1. Due to Public Authorities
of which:
– Public Authorities ex art. 24 (c) 10,597
2. Due to foreign Public Authorities
of which:
– Public Authorities ex art. 24 (d)
3. Due to banks
3.1 Current accounts and demand deposits
3.2 Fixed-term deposits
3.3 Loans
3.3.1 Reverse repos
3.3.2 Other
3.4 Amounts due under repurchase agreements of own equity instruments
3.5 Other liabilities
Total 10,597
Fair value – level 1 10,597
Fair value – level 2
Fair value – level 3
Total fair value – 10,597
Due to banks include amounts due to the Holy See and Vatican City State Public Authorities, the
statutory purpose of which is to administer the Holy See’s proprietary assets (at present APSA).
Amounts due as of 31 December 2015 was EUR 10.6m comprised solely by debt on demand to
APSA.
As of 31 December 2016, there were no amounts due to banks.
1.2 Subordinated liabilities
There are no subordinated liabilities recognized in this item.
73
IOR
Annual report 2016
ITEM 20 LIABILITIES – DUE TO CUSTOMERS
2.1 Detail by type
2016 2015
1. Current accounts and demand deposits 2,397,688 2,319,257
2. Fixed-term deposits 1,236 4,146
3. Loans
3.1 Reverse repos
3.2 Other
4. Amounts due under repurchase agreements of own equity instruments
5. Other payables
Total 2,398,924 2,323,403
Fair value – level 1
Fair value – level 2
Fair value – level 3 2,398,924 2,323,403
Total fair value 2,398,924 2,323,403
Due to customers had a slight increase from 2015, recording, on one hand, an increase in the number
of accounts and demand deposits, offset by a decrease in fixed-term deposits.
The above amounts includeliquidity and term deposits related to the Asset Management agreements,
for which IOR is the depository institution.
These are comprised of:
Deposits related to Asset management accounts 2016 2015
Deposits on demand 417,026 424,815
Time deposits
Total 417,026 424,815
The item Due to customers also includes a deposit at the disposal of the Commission of Cardinals
to support works of religion. As of the balance sheet date, this amounted to EUR 6.3m (2015: EUR
11.3m). The EUR 5.0m decrease was mainly due to the distribution of funds for charitable activities.
2.2 Subordinated liabilities
There are no subordinated liabilities recognized in this item.
ITEM 100 LIABILITIES – LEGATES
The item includes the deposits of the “Legates” amounting to EUR 47.1m (2015: 48.3m) as of 31
December 2016, comprised of 293 funds (2015: 295) donated to the Institute. The IOR has the
burden, for a significant period of time, of fulfilling specific ecclesiastical functions or otherwise
achieving purposes related to works of piety, apostolate and charity works, on the basis of its annual
income.
74
IOR
Annual report 2016
ITEM 110 LIABILITIES – OTHER LIABILITIES
Other liabilities 2016 2015
Inheritances to be settled 6,384 7,587
Invoices to be received 4,515 5,161
Outstanding checks 1,070 1,105
Remunerations to be paid 914 966
Other sundry creditors 908 404
Funds for charitable contributions 3,220 3,303
Liabilities for guarantees issued and commitments towards third parties 1,699 1,561
Securities purchased not settled
Total 18,710 20,087
The item “Inheritances to be settled” represents the property values of deceased donors pending resolution
of inheritance issues.
The amount of EUR 1.7m (2015: EUR 1.6m) reported under “Liabilities for guarantees issued and
commitments towards third parties” is due to guarantees in addition to the commitments to third
parties to lend funds of uncertain use (see paragraph 13.1 Guarantees and commitments).
Funds for charitable contributions are comprised of the Fund for Holy Masses and Fund for Missionary
Activities.
Fund for Missionary Activities
The Fund for Missionary Activities is used to distribute contributions to congregations and institutions
that operate missionary and charitable activities.
It is mainly funded by small donations with a commitment to execute Missionary activities.
Donations and distributions are recorded directly into the Fund’s account.
Distributions to the beneficiaries are approved by a Committee comprised of the Prelate, the “Aggiunto
al Direttore” and the Client Relationship Manager.
Fund for Holy Masses
The Fund for Holy Masses is used to distribute contributions to priests for Holy Masses.
It is financed through small donations with a commitment to the Holy Masses.
Donations and distributions are directly recorded into the Fund’s account.
Distributions to the priests are approved by a Committee comprised of the Prelate, the “Aggiunto
al Direttore” and the Client Relationship Manager.
75
IOR
Annual report 2016
The detail of Funds for charitable contributions is as follows:
Funds for charitable 2016 2015
A. Fund for Missionary Activities 156 239
1. Balance at 1 January 239 189
2. Donations received 86 145
3. Distributions for Missionary Activities (169) (95)
B. Fund for Holy Masses 3,064 3,064
1. Balance at 1 January 3,064 2,971
2. Donations received 83 154
3. Distributions for Holy Masses (83) (61)
Total 3,220 3,303
Distributions of funds to beneficiaries are subject to strict internal policies.
It should be noted that the charitable activities of the Commission of Cardinals are made through
a deposit included in item 20 of the liabilities.
ITEM 120 LIABILITIES – STAFF SEVERANCE FUND
10.1 Annual changes
2016 2015
A. Opening balance 6,788 6,551
B. Increases
B.1 Allocation for the year 534 530
B.2 Other changes 518
C. Decreases
C.1 Benefits paid (624) (84)
C.2 Other changes (223) (209)
D. Closing balance 6,993 6,788
The Staff severance fund comprises indemnities paid to personnel when they leave the IOR.
76
IOR
Annual report 2016
The change in the fund balance is summarised as follows:
2016 2015
Balance at 1 January 6,788 6,551
Current costs 459 457
Contribution by individuals 75 73
Transfers to benefit plan for pensions (223)
Advances (80) (84)
Advances restitution 148
Consideration paid during the year (544)
Actuarial (gain) loss of the year 370 (209)
Balance at 31 December 6,993 6,788
The actuarial assumptions used for the valuation of the Staff severance fund are the same as those
used for the Benefit Plan Liability for pensions, described in Item 130 (a) Liabilities.
As defined by IAS 19, a sensitivity analysis was performed on the variation of the main actuarial
assumptions included in the calculation model; these assumptions are:
• annual discount rate;
• annual rate of salary growth;
• annaul inflation rate;
• annual mortality rate
Annual discount rate Annual rate of salary growth Annual inflation rate Mortality rate
Liabilities +0,50 p.p. -0,50 p.p. +0,50 p.p. -0,50 p.p. +0,50 p.p. -0,50 p.p. +0,025 p.p. -0,025 p.p.
6,866 7,127 7,117 6,874 6,992 6,994 6,965 7,008
10.2 Other information
Please refer to the paragraphs regarding the accounting policies for more information on the calculation
of employee termination indemnities.
The portion of employee gross salaries retained by the Institute is 1.5%.
No payments were made to the Vatican Pension Plan.
Funds were managed by the IOR Treasury department.
ITEM 130 LIABILITIES – ALLOWANCES FOR RISKS AND CHARGES
11.1 Detail by type
2016 2015
1. Post employment benefits for pensions 121,088 108,338
2. Other allowances for risks and charges
2.1 legal disputes
2.2 staff expenses
2.3 other 3,500 16,500
Total 124,588 124,838
77
IOR
Annual report 2016
11.2 Annual changes
Provision for pension
and similar obligations Other provisions Total
A. Opening balance 108,388 16,500 124,838
B. Increases
B.1 Provision for the year 2,731 2,731
B.2 Time value changes
B.3 Changes due to discount rate variations 12,905 12,905
B.4 Other changes 223 223
C. Decreases
C.1 Utilization in the year (3,109) (13,000) (16,109)
C.2 Changes due to discount rate variations
C.3 Other changes
D. Closing balance 121,088 3,500 124,588
11.3 Pension plan liabilities defined benefit obligations
More in detail, the changes in the Plan concern the following items:
2016 2015
Opening balance 108,338 117,396
Current Service cost 607 780
Interest cost 2,031 1,811
Contribution by individuals 93 96
Transfer from staff severance fund 223
Pensions paid during the year (3,109) (3,075)
Transfer out
Actuarial (gain) loss of the year 12,905 (8,670)
Closing balance 121,088 108,338
The actuarial valuation of the defined benefit plan liability was performed using the following assumptions:
2016 2015
Annual inflation rate 2.00% 2.00%
Annual discount rate 1.43% 1.93%
Annual rate for revaluation of pension 2.00% 2.00%
Annual rate of real increase salary 2.35% 2.35%
The Current Service Cost is the actuarial present value of benefits due to employees for services rendered
during the period.
The Interest Cost is the increase in the present value of the obligation from the passage of time and
it is proportional to the discount rate used in the assessment of the previous year’s liabilities.
The Actuarial gain/loss is the change in the liability in the present year arising from:
• the effect of the differences between the previous actuarial assumptions and what has actually
occurred;
• the effect of the changes in actuarial assumptions.
The results are recognized directly to Equity in a specific reserve named “Valuation reserves” “Post- 78
IOR
Annual report 2016
employment benefit actuarial gain (loss) reserves” and the actuarial gain or loss is recorded in Other
Comprehensive Income.
For Staff severance fund and Provisions for pensions and similar obligations, in 2016, the Institute
recognized an actuarial loss of EUR 13.3m (2015: gain of EUR 8.9m) in Other Comprehensive
Income. Consequently, change in the “Valuation reserves” (item 140 Equity) was a loss of EUR
46.0m (2015: EUR -32.7m); the increased loss compared to the prior year is due to the decrease
in the discount rate to 1.43% in 2016 from 1.93% in 2015.
A total of 102 employees are active and contribute to the Pension plan (2015:109). A total of 74
former employees are in retirement and benefit from the plan (2015: 70).
As defined by IAS 19, a sensitivity analysis was performed on the variation of the main actuarial
assumptions included in the calculation model; these assumptions are:
• annual discount rate;
• annual rate of salary growth;
• annaul inflation rate;
• annual mortality rate.
Annual discount rate Annual rate of salary growth Annual inflation rate Mortality rate
Liabilities +0,50 p.p. -0,50 p.p. +0,50 p.p. -0,50 p.p. +0,50 p.p. -0,50 p.p. +0,025 p.p. -0,025 p.p.
110,727 133,037 120,674 119,123 131,768 109,479 120,757 121,407
11.4 Other information
Please refer to the paragraphs regarding the accounting policies for more information on the calculation
of the pension fund.
The portion of employee gross salaries retained by the Institute is 6%.
No payments were made to the Vatican Pension Plan.
Funds were managed by the IOR Treasury department.
11.5 Other provisions
As of 31 December 2016, based on analysis performed with the support of legal consultants, a liability
of EUR 3.5m was estimated for potential tax liabilities. The reestimation led to the recognition
of EUR 13m in income included in the item 160 Income Statement “Net provisions to risks
and charges” corresponding to item 130 Liabilities “Provision for risks and charges” line (b)
“Other provisions” of the balance sheet. As the estimate was based on critical assumptions, actual
results may differ from what is expected when the future event will take place.
The relative content of the item was explained in the paragraph 1.1.4.1 Other aspects – Critical accounting
estimates and judgements, Part 1 Accounting policies.
79
IOR
Annual report 2016
ITEM 160 170 EQUITY – RESERVES
12.1 Capital
Capital, as a separate component of Equity, represents a permanent endowment that cannot be reduced
or distributed, except in case of cessation or liquidation of the entity.
During 2016, no changes were recorded in Capital balance, amounting to EUR 300m.
Securities and liquid funds made up the Capital; in detail, deposits to APSA, other liquid assets,
supranational bonds and governative bonds with high quality credit rating.
12.2 Reserves
The equity balance is comprised of two different reserves, Available and Unavailable reserves.
Unavailable Reserves are earning reserves designed to further strengthen the Institute’s Equity and
long-term stability.
Available Reserves are earning reserves representing earnings that could potentially fulfill a “stabilization”
function, subject to a resolution of the Commission of Cardinals.
During 2016, no changes were recognized in Unavailable Reserves, amounting to EUR 100m, and
Available Reserves, amounting to EUR 282m.
Unavailable reserves are comprised of securities, properties and precious metals. In detail are gold
bars, medals and coins, investment in subsidiary (SGIR S.r.l.), real estate properties and liquid financial
instruments traded on regulated markets.
The Available Reserve is comprised of securities, representing liquid financial instruments traded
on regulated markets.
13 ADDITIONAL INFORMATION
13.1 Guarantees and commitments
2016 2015
1) Financial guarantees given
a) Banks 27 27
b) Customers 15 41
2) Commercial guarantees given
a) Banks
b) Customers
3) Irrevocable commitments to lend funds
a) Banks
b) Customers
i) of certain use
ii) of uncertain use 4,000 4,000
4) Underlying commitments on credit derivatives: protection sales
5) Assets pledged as collateral of third party commitments
6) Other commitments
Total 4,042 4,068
80
IOR
Annual report 2016
At the balance sheet date, the Institute has a commitment of EUR 4m of uncertain use issued in
favor of third parties.
The IOR issued in past three guarantees covered by assets held in custody.
No new guarantees were issued in 2016.
The guarantees were initially recognized at their nominal value, which is their fair value. In subsequent
periods, the guarantees are reported at the amount determined in accordance with IAS 37
“Provisions, Contingent Liabilities and Contingent Assets”.
13.4 Asset Management and Brokerage on behalf of third parties
2016 2015
1. Trading on behalf of customers
(a) purchases
(i) settled 129,087
(ii) to be settled
(b) sales
(i) settled 84,530
(ii) to be settled
2. Portfolio management (assets management)
(a) individual 3,110,929 3,185,685
(b) collective
3. Custody and administration of securities
(a) third party security held in deposit: related to depositary bank activities
(excluding portfolio management)
(i) security issued by the entity that prepare the financial statement
(ii) other securities
(b) third party securities held in deposit: other (excluding portfolio management)
(i) security issued by the entity that prepare the financial statement
(ii) other securities
(c) third party securities deposited with third parties 554,763 646,161
(d) proprietary portfolio securities deposited with third parties 2,508,160 2,586,923
4. Other operations
Assets under Management agreements are valued using the mark-to-market method. They include
the total value of portfolios, and liquid and term deposits. Accruals are also included, both on securities
and on liquid and term deposits.The IOR is the depository of liquid and for term deposits,
amounting to EUR 417.2m (2015: EUR 424.8m), as disclosed in item 20 Liabilities “Due to customers”.
Assets under custody agreements are also valued based on current bid prices, using the mark-to-market
method. They also include accruals on interest to be received on debt securities.
Due to the change in accounting system, the data for 2015 were too heavy to be extracted and barely
relevant in comparison to the information provided.
81
IOR
Annual report 2016
PART 3. INFORMATION ON INCOME STATEMENT
ITEM 10 INCOME STATEMENT – INTEREST AND SIMILAR INCOME
1.1 Interest income and similar income: detail
2016 2015
Debt Loans Other Total Total
securities transactions
1. Financial assets held for trading 22,574 22,574 26,202
2. Financial assets available for sale
3. Financial assets held to maturity 15,217 15,217 16,284
4. Due from banks 135 1,480 1,615 3,844
5. Due from customers 46 380 426 2,311
6. Financial assets carried at fair value
7. Hedging derivatives
8. Other assets
Total 37,972 1,860 39,832 48,641
Interest and similar income (other than those recorded in the item Net value adjustments/write
backs) accrued during the year in positions classified as impaired at the balance sheet date amounted
to EUR 310,000. They were directly deducted from line 5 in the table above.
ITEM 20 INCOME STATEMENT – INTEREST AND SIMILAR EXPENSES
1.4 Interest and similar expenses: detail
2016 2015
Payables Securities Other Total Total
transactions
1. Due to Public Entities
(i) Public Authorities
(ii) Foreign Public Authorities
(iii) International and Regional Organizations
2. Due to banks (52) (52) (16)
3. Due to customers (3,117) (3,117) (4,987)
4. Outstanding securities
5. Financial liabilities held for trading
6. Financial liabilities designated at fair value through profit and loss
7. Other liabilities and funds
8. Hedging derivatives
9. Due to other subjects
Total (3,169) (3,169) (5,003)
In 2016 the Institute recorded a general decrease in all items related to interest margin, both income
and expense, bringing consequently to a net reduction in the Interest Margin.
Interest income decreased due to the impact of lower interest rates determined by the European Central
Bank in 2014, 2015 and 2016, and the expiration of many positions with higher interest rates.
Interest expense decreased on interest payable on customer deposits (-37%) from the expiration of
term deposits with high interest rates. 82
IOR
Annual report 2016
ITEM 40 INCOME STATEMENT – FEE AND COMMISSION INCOME
2.1 Fee and commission income: detail
2016 2015
a) Guarantees given/received 1 1
b) Credit derivatives
c) Administration, brokerage and consultancy services:
1. trading in financial instruments 654 1,340
2. trading in currencies
3. portfolio management
3.1 individual 12,483 13,667
3.2 collective
4. Custody and administration of securities 113 208
5. Custodian bank
6. Securities placement
7. Receipt and transmission of orders activity
8. Consulting
8.1 investments
8.2 financial structure
9. Distribution of third-party services
9.1 portfolio management
9.1.1 individual
9.1.2 collective
9.2 insurance products
9.3 other products
d) collection and payment services 2,196 2,053
e) servicing of securitization operations
f) factoring services
g) rate and tax collection office services
h) multilateral trading systems management
i) current account keeping and management 369 400
j) other services 21 41
Total 15,837 17,710
The decrease in Fee and Commission income was due to the general reduction in customer transactions,
the decrease in assets under management agreements, and the shift of some high network
clients from equity lines to asset management lines (especially bond ones) with lower commission.
2.2 Fee and commission income: distribution channels of products and services
All the IOR products and services are offered at IOR locations in Vatican City State.
83
IOR
Annual report 2016
ITEM 50 INCOME STATEMENT – FEE AND COMMISSION EXPENSE
2.3 Fee and commission expense: detail
2016 2015
a) Guarantees given/received
b) Credit derivatives
c) Administration, brokerage and consultancy services:
1. trading in financial instruments (83) (648)
2. trading in currencies
3. portfolio management
3.1 own portfolio
3.2 third-party portfolio
4. Custody and administration of securities (1,613) (913)
5. Placement of financial instruments
6. Sales of financial instrument, products and services through other outlets
d) Collection and payment services (761) (921)
e) Administration and management of current accounts (571)
f) Other services (1)
Total (3,029) (2,482)
The increase in Fee and commission expense was mainly due to the increase in custody and administration
fees for securities (doubled compared with 2015) and fee and commissions charged by correspondent
banks on current accounts of the Institute as charges for the management of liquidity.
ITEM 70 INCOME STATEMENT – DIVIDENDS AND SIMILAR INCOME
3 Dividends and similar income: detail
2016 2015
Dividends Income Dividends Income
from from
UCI UCI
A. Financial assets held for trading 860 812 686 800
B. Financial assets available for sale 435 468
C. Financial assets carried at fair value through profit and loss
D. Investment in subsidiaries
Total 1,295 812 1,154 800
Dividends received in 2016 for financial assets held for trading was EUR 1.7m (2015: EUR 1.5m),
an increase of 12.5%.
In 2016, the Institute received dividends of EUR 435,000 from investment securities recorded as
financial assets available for sale (2015: EUR 468,000).
84
IOR
Annual report 2016
ITEM 80 INCOME STATEMENT – NET INCOME FROM TRADING ACTIVITIES
4. Net income from trading activities: detail
2016
Gains Profit from Losses Losses from Net
trading trading income
(A) activities (B) (C) activities (D) [(A+B) – (C+D)]
1. Financial assets held for trading
1.1 Debt securities 6,167 1,429 6,041 1,555
1.2 Equity securities 1,603 1,509 94
1.3 UCI units 1,693 14,445 (12,752)
1.4 Loans
1.5 Other 126 126
2. Financial liabilities held for trading
2.1 Debt securities
2.2 Payables
2.3 Other
3. Financial assets and liabilities:
exchange differences 1,529 470 5 1,994
4. Derivatives
4.1 Financial derivatives
– On debt securities and interest rates
– On equity securities and stock indices
– On currencies and gold
– Other
4.2 Credit derivatives
Total 10,992 2,025 (22,000) (8,983)
2015
Gains Profit from Losses Losses from Net
trading trading income
(A) activities (B) (C) activities (D) [(A+B) – (C+D)]
1. Financial assets held for trading
1.1 Debt securities 2,467 8,698 11,632 16,670 (17,137)
1.2 Equity securities 2,330 2,604 1,873 3,368 (307)
1.3 UCI units 63 104 18 149
1.4 Loans
1.5 Other 18 18
2. Financial liabilities held for trading
2.1 Debt securities
2.2 Payables
2.3 Other
3. Financial assets and liabilities:
exchange differences 24 2,727 236 617 1,899
4. Derivatives
4.1 Financial derivatives
– On debt securities and interest rates
– On equity securities and stock indices
– On currencies and gold
– Other
4.2 Credit derivatives
Total 4,884 14,133 13,741 20,673 (15,378)
85
IOR
Annual report 2016
Below is a summary of the net trading results in 2016 compared to 2015.
In 2016, debt securities recognized a gain of EUR 1.6m from a loss of EUR 17.1m in 2015. Realized
gain from trading activity was EUR 1.4m compared to a loss of EUR 8.0m in 2015, and the
unrealized gain was EUR 120,000 compared to a loss of EUR 9.1m in 2015.
In 2016, equity securities recognized a gain of EUR 94,000 from a loss of EUR 307,000 in 2015.
No realized profit (loss) was recognized compared to a loss of EUR 764,000 in 2015, while unrealized
gain (loss) was EUR 94,000, compared to EUR 457,000 in 2015.
In 2016, UCI units recognized a loss of EUR 12.8m from a gain in 2015 of EUR 149,000. No realized
gain was recorded in 2016 compared to a gain of EUR 86,000 in 2015, while unrealized loss
was EUR 12.8m compared to an unrealized gain of EUR 63,000 in 2015.
Line 1.5 “Financial assets held for trading: other” includes gains (losses) from currency trade, gold
and other precious metals, recognizing a gain of EUR 126,000 in 2016 from EUR 18,000 in 2015
(realized).
“Financial assets and liabilities: exchange differences” recognized a gain of EUR 2.0m from a profit
of EUR 1.9m in 2015, comprised of EUR 470,00 realized profit in 2016 compared to EUR 2.1m
in 2015 and unrealized profit of EUR 1.5m in 2016 compared to unrealized loss of (EUR
212,000) in 2015.
ITEM 100 INCOME STATEMENT – PROFIT (LOSS) ON DISPOSAL OR REPURCHASE
6. Profit (loss) on disposal or repurchase: detail
Voci/Componenti reddituali 2016 2015
Profit Losses Net Profit Losses Net
income income
Financial assets
1. Due from banks
2. Due from customers
3. Financial assets available for sale
3.1 Debt securities
3.2 Equity securities 1.518 (19) 1.499
3.3 UCI units
3.4 Loans
4. Financial assets held to maturity
Total assets 1.518 (19) 1.499
Financial liabilities
1. Due to banks
2. Due to customers
3. Outstanding securities
Total liabilities
86
IOR
Annual report 2016
ITEM 130 INCOME STATEMENT – NET LOSSES/REVERSAL ON IMPAIRMENT
8.1 Net impairment losses on loans: detail
Value adjustments (1) Write-backs (2)
Specific Specific Portfolio
2016 2015
Derecognition Other
Portfolio
ABAB (1)+(2)
1. Due from banks
– Loans
– Debt securities
2. Due from customers
Purchased impaired loans
– Loans
– Debt securities
Other receivables
– Loans (1,453) 350 58 (1,045) 353
– Debt securities
Total (1,453) 350 58 (1,045) 353
8.2 Net impairment losses on financial assets available for sale: detail
Value adjustments (1) Write-backs (2)
Specific Specific
2016 2015
Derecognition Other A B (1)+(2)
1. Debt securities
2. Equity securities (148) (148)
3. UCI units
4. Loans to banks
5. Loans to customers
Total (148) (148)
8.4 Net impairment losses on other financial assets: detail
Value adjustments (1) Write-backs (2)
Specific Specific Portfolio
2016 2015
Derecognition Other
Portfolio
ABAB (1)+(2)
1. Guarantees given (138) (138) (156)
2. Credit derivatives
3. Commitments to lend funds
4. Other operations
Total (138) (138) (156)
87
IOR
Annual report 2016
ITEM 150 INCOME STATEMENT – ADMINISTRATIVE EXPENSES
9.1 Personnel expenses: detail
2016 2015
A. Staff
1. Wages and salaries (5,078) (5,534)
2. Social security charges
3. Termination indemnities
4. Supplementary benefits (630) (658)
5. Provisions for termination indemnities (459) (457)
6. Provisions for post employment benefits
(a) defined contribution plans
(b) defined benefit plans (2,638) (2,591)
7. Payments to external pension plans
(a) defined contribution plans
(b) defined benefit plans
8. Other benefits in favor of employees (546) (889)
B. Current Personnel with contracts pursuant to ex art. 10 (1)
1. letter (b)
2. letter (c)
3. letter (d)
C. Fees and charges for:
1. Board of Superintendence (504) (796)
2. Directorate (299) (241)
3. Revisori (91) (101)
D. Early retirement cost
E. Recovery of expenses for employees seconded to other entities
F. Reimbursement of expenses for employees of the institutions and organizations
of the Holy See and the Vatican City State placed at the Institute
Total (10,245) (11,267)
9.2 Average number of employees by categories
Type Total Managers Officials Staff
Average number 104 2 5 97
Reimbursement of expenses for employees of the institutions and organizations of the Holy See and
the Vatican City State placed at the Institute.
9.3 Post employment defined benefit plans: costs and revenues
Post employment defined benefit plans: costs 2016 2015
Current Service cost of internal Pension Plan 607 780
Interest cost of internal Pension Plan 2,031 1,811
Post employment costs: contribution to Vatican Pension Plan 630 658
Total Costs 3,268 3,249
Post employment defined benefit plans: revenues
Total 3,268 3,249
88
IOR
Annual report 2016
9.5 Professional service expenses: detail
2016 2015
A. Professional services expenses
1. Legal services (2,437) (4,552)
2. Directional consultants (718) (1,438)
3. Technical consultants (288) (301)
4. Operational consultants (342) (1,132)
5. Translational services (56) (41)
B. Expenses related to works contract
1. ex art. 10 (1) (a)
2. ex art. 11 (1)
C. Expenses related to outsourcing contracts
D. Expenses related to external auditors (121) (143)
Total (3,962) (7,607)
9.6 Other administrative expenses: detail
2016 2015
1. Software maintenances (1,441) (1,247)
2. Other maintenances (800) (592)
3. Local rent (1,000) (1,000)
4. Information providers (379) (483)
5. AIF contribution (346) (230)
6. Other expenses (913) (1,000)
Total (4,879) (4,552)
ITEM 160 INCOME STATEMENT – NET PROVISION FOR RISKS AND CHARGES
Detailed information is provided in Item 130 (b) Liabilities.
89
IOR
Annual report 2016
ITEM 170 INCOME STATEMENT – NET VALUE ADJUSTMENTS TO/RECOVERIES ON TANGIBLE ASSETS
11. Net value adjustments to/recoveries on tangible assets: detail
2016
Depreciation Impairment Recoveries Net
losses income
(a) (b) (c) (a+b-c)
A. Tangible assets
A.1 Owned assets
– Functional use (83) (83)
– For investment
A.2 Acquired under finance lease
– Functional use
– For investment
Total (83) (83)
2015
Depreciation Impairment Recoveries Net
losses income
(a) (b) (c) (a+b-c)
A. Tangible assets
A.1 Owned assets
– Functional use (64) (64)
– For investment
A.2 Acquired under finance lease
– Functional use
– For investment
Total (64) (64)
ITEM 180 INCOME STATEMENT – NET VALUE ADJUSTMENTS TO/RECOVERIES ON INTANGIBLE ASSETS
12. Net value adjustments to/recoveries on intangible assets: detail
2016
Amortization Impairment Recoveries Net
losses income
(a) (b) (c) (a+b-c)
A. Intangible assets
A.1 Owned assets
– Generated internally by the Institute
– Other (683) (683)
A.2 Acquired under finance lease
Total (683) (683)
2015
Amortization Impairment Recoveries Net
losses income
(a) (b) (c) (a+b-c)
A. Intangible assets
A.1 Owned assets
– Generated internally by the Institute
– Other (512) (512)
A.2 Acquired under finance lease
Total (512) (512) 90
IOR
Annual report 2016
ITEM 190 INCOME STATEMENT – OTHER OPERATING INCOME (EXPENSE)
13.1 Other operating income (expense): detail
2016 2015
A. Income 736 13,720
Extraordinary income 558 120
Recovery of amounts for gold and precious metals 178
Closure of past years issue 13,600
B. Expenses (729) (3,231)
1. Operating losses (715) (54)
2. Extraordinary expenses (14) (324)
3. Impairment of amounts for gold and precious metals (2,853)
Total 7 10,489
ITEM 220 INCOME STATEMENT – NET RESULT OF FAIR VALUE VALUATION OF TANGIBLE AND
INTANGIBLE ASSETS
15. Net result of fair value valuation of tangible and intangible assets: detail
Exchange differences
2016 Revaluations Impairment Positive Negative Net income
(a) (b) (c) (d) (a-b+c-d)
A. Tangible assets
A.1 Owned assets
– Functional use
– Held for investment 136 (53) 83
A.2 Acquired under finance lease
– Functional use
– Held for investment
B. Intangible assets
B.1 Owned assets
B.1.1 Generated internally by the Institute
B.1.2 Other
B.2 Acquired under finance lease
Total 136 (53) 83
Exchange differences
2015 Revaluations Impairment Positive Negative Net income
(a) (b) (c) (d) (a-b+c-d)
A. Tangible assets
A.1 Owned assets
– Functional use
– Held for investment 517 (16) 501
A.2 Acquired under finance lease
– Functional use
– Held for investment
B. Intangible assets
B.1 Owned assets
B.1.1 Generated internally by the Institute
B.1.2 Other
B.2 Acquired under finance lease
Total 517 (16) 501 91
IOR
Annual report 2016
PART 4. INFORMATION ON COMPREHENSIVE INCOME
2016 Gross Income Net
amount tax amount
10. Profit (loss) for the year 36,001 36,001
Other comprehensive income that may not be reclassified
to the income statement
20. Tangible assets
30. Intangible assets
40. Defined benefit plans (13,275) (13,275)
50. Non current assets held for sale
60. Share of valuation reserves connected with investments
carried at equity
Other comprehensive income that may be reclassified
to the income statement
70. Hedges of foreign investment
(a) fair value changes
(b) reclassification to the income statement
(c) other changes
80. Foreign exchange differences
(a) fair value changes
(b) reclassification to the income statement
(c) other changes
90. Cash flow hedges
(a) fair value changes
(b) reclassification to the income statement
(c) other changes
100. Financial assets available for sale
(a) fair value changes (1,838) (1,838)
(b) reclassification to the income statement
– impairment losses 148 148
– gains (losses) from disposals (2,589) (2,589)
(c) other changes
110. Non current assets held for sale
(a) fair value changes
(b) reclassification to the income statement
(c) other changes
120. Share of valuation reserves connected with investments
carried at equity:
(a) fair value changes
(b) reclassification to the income statement
– impairment losses
– gains (losses) from disposals
(c) other changes
130. Total other comprehensive income (17,554) (17,554)
Total Comprehensive Income (item 10 + item 130) 18,447 18,447
92
IOR
Annual report 2016
2015 Gross Income Net
amount tax amount
10. Profit (loss) for the year 16,127 16,127
Other comprehensive income that may not be reclassified
to the income statement
20. Tangible assets
30. Intangible assets
40. Defined benefit plans 8,880 8,880
50. Non current assets held for sale
60. Share of valuation reserves connected with investments
carried at equity
Other comprehensive income that may be reclassified
to the income statement
70. Hedges of foreign investment
(a) fair value changes
(b) reclassification to the income statement
(c) other changes
80. Foreign exchange differences
(a) fair value changes
(b) reclassification to the income statement
(c) other changes
90. Cash flow hedges
(a) fair value changes
(b) reclassification to the income statement
(c) other changes
100. Financial assets available for sale
(a) fair value changes 4,777 4,777
(b) reclassification to the income statement
– impairment losses
– gains (losses) from disposals
(c) other changes
110. Non current assets held for sale
(a) fair value changes
(b) reclassification to the income statement
(c) other changes
120. Share of valuation reserves connected with investments
carried at equity:
(a) fair value changes
(b) reclassification to the income statement
– impairment losses
– gains (losses) from disposals
(c) other changes
130. Total other comprehensive income 13,657 13,657
Total Comprehensive Income (item 10 + item 130) 29,784 29,784
93
IOR
Annual report 2016
ATTACHMENTS
A.1 Disclosure concerning the fees of the independent auditors and services other than
auditing
During 2016, the IOR did not pay fees to the companies belonging to the network of the audit
firm Deloitte & Touche S.p.A. with the exception of those related to the audit of the annual accounts
amounting to EUR 121.
The fees due are those contractually agreed, inclusive of any indexation and reimbursement of expenses
calculated as a forfeit. Fees do not include out-of-pocket expenses or taxes.
A.2 Exchange rates as of the balance sheet date
The balances at year-end, denominated in foreign currencies, are measured at the exchange rates
observed by the European Central Bank on the last working day of the year (in 2016: 30 December).
For the other currencies, the rates used are those provided by infoproviders on the same date.
For the 2016 financial statements, the rates were determined as follows:
Currency 2016 2015
U.S. Dollars USD 1.0541 1.0926
Swiss Francs CHF 1.0739 1.0814
Canadian Dollars CAD 1.4188 1.5171
English Pounds GBP 0.8562 0.7380
Australian Dollars AUD 1.4596 1.4990
Japanese Yen JPY 123.40 131.66
Czech Crowns CZK 27.0210 27.029
Danish Crowns DKK 7.4344 7.4625
Hungarian Forints HUF 309.83 313.15
Norwegian Crowns NOK 9.0863 9.6160
Polish Zloty PLZ 4.4103 4.2400
Swedish Crowns SEK 9.5525 9.1878
Brazilian Reais BRE 3.4305 4.2590
South African Rand ZAR 14.4570 16.8847
Hong Kong Dollars HKD 8.1751 8.4685
South Korean Won KRW 1,224.94 1,284.79
Singapore Dollars SGD 1.5234 1.5449
New Zealand Dollars NZD 1.5158 1.5959
A.3 Date of authorisation for issue
The financial statements were presented and authorised for issuance by the Directorate on 27 March
2017 and approved by the Board of Superintendence on 26 April 2017.
94
IOR
Annual report 2016
PART 5. INFORMATION ON RISKS AND HEDGING POLICIES
5.1 Introduction
The Institute’s policies and procedures for the management and monitoring of risks arising from
investments decisions, are summarized in the following paragraphs, with a focus on the parties involved
and their responsibilities. The Institute considers it appropriate:
a) to assign risk measurement functions and risk integrated control to a specific department,
headed by the Risk Management department;
b) to assign the functions dedicated to the definition of operating limits, the authorization of possible
overruns or payment requests within assigned limits, to the appropriate Risk Committee.
Other bodies of the Institute are involved and assigned with different tasks in risk management and
monitoring, such as the Board of Superintendence, Directorate, Internal Audit department, Treasury
department, Compliance.
This structure is based on the rules and the requirements provided by the Financial Information
Authority (AIF) for a compliant internal audit system, as defined by Regulation No.1/2015 on “Prudential
Supervision of Entities Carrying out financial activities on a professional basis (“Regolamento
n.1”), implementing Title III of the Law introducing norms of “Transparency, Supervision and Financial
Intelligence” no. XVIII issued on 8 October 2013 (“Law no. XVIII”).
The Risk Management function is an independent structure from the risk-taking functions, reporting
directly to the Directorate and with functional reporting also to the Board of Superintendence.
The following paragraphs set out the rules of the different organizational structures and the governing
bodies involved in the monitoring and managingement of risks.
5.1.1 Duties and responsibilities of bodies involved
The Institute bodies involved in various capacities in the management and monitoring of risk relating
to investment decisions are the following:
• Board of Superintendence;
• Directorate;
• Risk Committee;
• Risk Management Department;
• Compliance Department;
• Internal Audit Department;
• Head of Treasury Department;
• Investment Committee.
5.1.1.1 Board of Superintendence
The Board of Superintendence is responsible for defining the strategic guidelines and general policies
for risk management. The Board of Superintendence can request the Directorate to update the
guidelines for the measurement and assessment of risks.
5.1.1.2 Directorate
The Directorate establishes, the overall strategies, general policies and guidelines set forth by the
Board of Superintendence and any amendments thereto, the risk management and monitoring 95
IOR
Annual report 2016
methodologies and their implementation and integration proposed by the Risk Committee, and
the general structure of market and credit operational limits (counterparty risk and issuer risk).
The Directorate also establishes periodically, based on the proposal of the Risk Committee, the limits
granted to new trading partners.
The Directorate monitors the risk exposure on a daily basis, through reports produced by the Risk
Management department, and is informed promptly by the department when operational limits
have been exceeded and can request an emergency meeting of the Risk Committee.
When operational limits are exceeded, based on a proposal from the Risk Committee, the Directorate
determines the way in which the overrun may be managed:
a) The Directorate can authorize the overrun specifying the period for which the authorization
is granted;
b) The Directorate can ask the head of the operating area involved for a recovery plan to be established.
The Directorate then authorizes the plan, or can ask for recovery in different ways
and/or in different periods than the recovery period proposed.
5.1.1.3 Risk Committee
A Risk Committee has been established by the Directorate and chaired by Head of Risk Management
department with the aim:
• to propose a Risk Appetite Framework and management and control methodologies and all subsequent
amendments thereof, in compliance with the general limits set up by RAF;
• to propose to the Directorate the general structure of market and credit operational limits (counterparty
risk and issuer risk);
• to propose periodically to the Directorate credit limits granted to the new trading partners,
within the general limits defined in the RAF;
• to periodically review the Institute’s risk trend, with specific focus on the most relevant events
or those with the greatest impact;
• in case of an emergency meeting, where operational limits have been exceeded, to express an
opinion to the Directorate on the authorization for exceeding limits, or on the recovery plan
arrangements.
The organizational aspects of the Risk Committee are disclosed in an appropriate regulation.
5.1.1.4 Risk Management Department
The Institute’s Risk Management department:
• presents to the Risk Committee issues related to the Institute’s exposure to market, credit, liquidity,
operational and reputational risks, proposing methodologies, instruments and processes
for the management of those risks;
• is responsible for the implementation, validation and maintenance of an adequate risk exposure
control system and its performance;
• on a daily basis, observes the market, credit and liquidity risks and trading activity performance,
preparing specific reports for the Board, the Directorate and the head of Treasury Department;
• monitors the compliance with the risk indicators outlined in the Risk Appetite Framework
(RAF) approved by the Board of Superintendence, preparing specific reports;
• monitors the adherence to operational limits in the Institute’s trading activity, promptly informing
the Directorate and the head of Treasury Department of any overruns. When limits are exceeded,
it can request an emergency meeting of the Risk Committee;
• calculates capital requirements in compliance with legal requirements. 96
IOR
Annual report 2016
5.1.1.5 Compliance Department
The IOR Compliance Department, in accordance with AIF Regulation No. 1, oversees, using a riskbased
approach, management of the risk of non-compliance in corporate activity, ensuring that internal
procedures are suitable to prevent such risk.
In particular, it is responsible for managing the risk of non-compliance with the most important
regulations, such as those relating to financial activity and brokerage, anti-money laundering, and
management of conflicts of interest, ensuring that the internal procedures are suitable to mitigate
these risks.
As regulated by Article 29 of Regulation No. 1, in order to achieve its mission, the Compliance Department:
• remains current on the rules applicable to the Institute and its activities and measures/assesses
the impact of any changes on existing processes and internal procedures;
• verifies compliance with external regulatory requirements and self-regulation;
• proposes organizational and procedural changes that ensure adequate supervision of the risk of
non-compliance with identified rules;
• monitors effectiveness of the suggested organizational changes for prevention of the risk of noncompliance;
• prepares direct information flows for the Institute’s governance bodies and for the other concerned
functions/structures;
• provides advice and assistance to the Institute’s governance bodies for all matters in which the
non-compliance risk is relevant as well as collaboration in training personnel on the provisions
applicable to their activities.
5.1.1.6 Internal Audit Department
The Institute’s Internal Audit department verifies through the audit plan:
• the adherence to risk management procedures as established by the Board of Superintendence
and by the Directorate, based on a proposal from the Risk Committee;
• the adequacy of the risk monitoring tools and procedures related to the Institute’s investment
decisions.
5.1.1.7 Head of Treasury Department
• Defines the operating investment decisions to be made on financial markets, ensuring consistency
with the strategic goals and predetermined limits.
• Requests revisions to the assigned operational limits, or the authorization to engage with new
counterparties, subject to the review of the Risk Committee.
• Defines, within the limits of the authority granted, the necessary corrective actions to restore
the defined risk/return profile.
5.1.2 Risk culture and further developments
The Institute is involved in a complete overhaul of its current financial, credit, liquidity, reputational
and operational risks management programs.This involves the strengthening of the Risk Management
department through the acquisition of new skills, the revision of the integrated system of
risk measurement and the development of specific frameworks for the management of reputational
and operational risks.
The approval of a Risk Appetite Framework integrated in the activities of daily risk management 97
IOR
Annual report 2016
allows for the development and dissemination of a risk culture, particularly in the functions dedicated
to the management of financial risks, which are the main source of risk. The development
and implementation of framework dedicated to reputational and operational risks, as well as the
focus on the risks of non-compliance, will allow even stronger risk culture across the Institute.These
actions, together with the controls already in place on anti-money laundering and combating the
financing of terrorism, will complete the system of risk management and monitoring of the Institute.
5.2 Credit risk
Format and content of information on credit risk and related hedging policies.
5.2.1 General aspects
Credit risk rises from the possibility that counterparties may not honour their commitments. Depending
on the nature of those commitments, the Institute’s credit risk may be divided in two categories:
a) credit risk arising from the Institute’s trading activity for their own account and on behalf of
its clients. Credit risk represents the risk that a counterparty may not fulfill its contractual obligations
related to a transaction concerning financial instruments. This risk may be classified
into three categories:
1. cash risk (e.g. deposits);
2. issuer risk (e.g. bond purchases);
3. counterparty risk, mainly generated by the operations in Delivery versus Payment (e.g. term
operations, repos).
b) credit risk arising from loans to customers, classified in the financial statements as “Due from
customers”; within this risk category, the Institute considers it appropriate not to measure this
risk because:
• the item is not material when compared to total assets;
• the exposure is limited to Catholic congregations and Vatican employees, both of which have
low risk categories by their nature;
• credits are usually accompanied by guarantees: securities, asset management or, for the Institute
employees, post employment benefits.
It is to be mentioned that the Institute is not authorized by the Autorità di Informazione Finanziaria
to carry out the activity of “lending” (cfr. art. l (l) (b) of the Law n.XVIII and art. 3 (24) (b) of the
Regulation No. l), as credit activities on its own. However, it is authorized to make “advances” that
is to disburse funds to its clients and to a limited extent following guarantee of future income (such
as, for example, in the case of the advance of salary or pension paid by the Holy See or the Governatorato
of Vatican City) or guaranteed by financial assets of the same amount deposited by the
clients at the Institute.
In general, the main credit risks associated with investment in securities, mainly issued by government
entities and bank deposits. Considering the overall interest rates and returns offered, the strategy
during 2016 was to focus mainly on issuers and purchases with high returns, considering implicit
risks, giving preference to Eurozone government issuers with BBB rating and increasing
purchases in USD currency.
At the end of 2016, the bond securities portfolio amounted to EUR 2.4bn with an average duration
of 1.37 years and high credit standing (99.6% investment grade). The bond securities portfolio
is mainly comprised of Italian and Spanish government bonds (45.57% of the total) and bank
securities (23.18% of the total). 98
IOR
Annual report 2016
Additional details on the bond portfolio composition are provided in the next paragraphs.
5.2.2 Credit risk management policies
5.2.2.1 Organizational aspects
The Treasury Department is responsible for the management and monitoring of credit risks over
trading activity and collections of amounts due from clients. The Treasury Department is qualified
to assume credit risk in compliance with operational limits. Particularly, the process of risk assumption
involves the following:
• the Director General, delegates the assumption of credit risks to the Treasury Department,
within predetermined by amount, type and counterparty;
• the Treasury Department, assumes credit risk in its operations in compliance with its defined
limits.The assumption of credit risk for amounts greater than the predetermined limit assigned
to the department requires the authorisation of the Director General;
• the Risk Committee, supporting the Director General in establishing a system ofcredit risk management
and monitoring, the definition of operational limits, the analysis of any overruns and
in evaluating authorisations of limits exceeded;
• the Risk Management Department, daily monitors compliance with operational limits,
promptly reporting to the Directorate any unauthorized overruns.
5.2.2.2 Management, measurement and control systems
Credit risk monitoring activity is delegated to the Risk Management Department, applying the Institute’s
specific-methodology, validated by the Risk Committee and approved by the Director General.
This methodology provides, in particular, for the definition of:
• a set of determined counterparties with which the Treasury department is allowed to engage
with. For each counterparty, the type of risk that the Institute can assume and the maximum
amount of exposure are defined;
• credit risk quantification criteria for each financial instrument, distinguishing between counterpart
risk, issuer risk and cash risk;
• add-on quantification criteria to be applied to all contracts with future settlement, diversified
by maturity and margining practices.
Concerning the maximum amount of exposure to each counterparty, the methodology provides for
the use of an internal rating, defined by the characteristics of the counterparty, the rating from International
Rating Agencies (Moody’s, S&P, Fitch) and credit spread level quoted in the market
(spread on Credit Default Swaps). The use of the credit default swaps spread enables prompt updating
of the internal rating and their credit maximum exposure when the market shows signs of
difficulties with a determined issuer before these difficulties can lead to a change of the counterparty’s
rating.
In addition to the limits defined above, the Board of Superintendence defined other limits at trading
portfolio level based on a sensitivity spread, distinguishing between government and corporate
issuer. The impact of this stress test at the closing date of this financial statements amounting respectively
to EUR 18.9m and EUR 18.2m.
5.2.2.3 Credit risk mitigation techniques
Currently, the Institute has no offsetting agreements in place with financial counterparties and does
not operate in the credit derivatives market. 99
IOR
Annual report 2016
5.2.2.4 Non-performing financial assets
For amounts due from clients, an internal monitoring system assists the Directorate to determinine
if there is objective evidence of the impairment of loans, based on the following criteria established
by the Institute:
• default in contractual payments of both capital and interest;
• delays in payments due to liquidity problems of customers;
• deterioration in the value of the guarantees provided.
The IOR has also issued guarantees requested by customers covered by assets held in custody, which
are disclosed on paragraph 13.1 Part 3.
5.2.3 Credit quality
As disclosed in AIF Circular, the use of the term “credit exposures” excludes equity securities and
UCI units. The use of the term “exposures” includes equity securities and UCI units.
1 Performing and non-performing credit exposures: amounts, adjustments, changes, economic
and geographical detail
1.1 Detail of credit exposures by portfolio classification and credit quality (book values)
Bad loans Unlikely Non performing Performing Other
to pay past due past due performing Total
exposures exposures exposures
1. Financial assets available for sale
2. Financial assets held to maturity 558,956 558,956
3. Due from banks 643,229 643,229
4. Due from customers 7,469 764 71 20,848 29,152
5. Financial assets carried at fair value
6. Financial assets being disposed
Total 2016 7,469 764 71 1,223,033 1,231,337
Total 2015 7,718 2,278 681 1,334,464 1,345,141
Note: There are no forborne exposures.
The amount of past due exposures (EUR 71,000) has remained the same for more than 1 year. Based
on the analysis of debtors at the balance sheet date, there was no objective evidence of potential insolvency
of the customer and no impairment loss was recognized.
1.2 Detail of credit exposures by portfolio classification and credit quality (gross and net values)
Non-performing assets Performing assets
Gross Individual Net Gross Collective Net Total
exposure adjustments exposure exposure adjustments exposure (net
exposure)
1. Financial assets available for sale
2. Financial assets held to maturity 558,956 558,956 558,956
3. Due from banks 643,229 643,229 643,229
4. Due from customers 24,842 (16,609) 8,233 21,541 (622) 20,919 29,152
5. Financial assets carried at fair value
6. Financial assets being disposed
Total 2016 24,842 (16,609) 8,233 1,223,726 (622) 1,223,104 1,231,337
Total 2015 25,344 (15,348) 9,996 1,335,825 (680) 1,335,145 1,345,141
100
IOR
Annual report 2016
Assets of evidently low credit Other assets
Cumulated capital losses Net exposure Net exposure
1. Financial assets held for trading 1,831,693
2. Hedging derivatives
Total 2016 1,831,693
Total 2015 1,563,528
1.3 On- and off-balance sheet credit exposures to banks: gross and net values and past due
brackets
Type of exposure/value Gross exposure
Non-performing assets
Up to 3 3-6 6-12 Over Performing Individual Collective Net
months months months 1 year assets adjust- adjust- exposure
ments ments
A. On balance sheet exposures
a) Bad loans
– of which: forborne exposures
b) Unlikely to pay
– of which: forborne exposures
c) Non-performing past due exposures
– of which: forborne exposures
d) Performing past due exposures
– of which: forborne exposures
e) Other performing exposures 1,197,481 1,197,481
– of which: forborne exposures
Total A 1,197,481 1,197,481
B. Off-balance sheet exposure
a) Non performing
b) Performing
Total B
Total A + B 1,197,481 1,197,481
On-balance sheet exposures include all on-balance sheet financial assets claimed from banks, irrespective
of their portfolio of allocation.
101
IOR
Annual report 2016
1.7 On- and off-balance sheet credit exposures to customers: gross and net values and aging
Type of exposure/value Gross exposure
Non-performing assets
Up to 3 3-6 6-12 Over Performing Individual Collective Net
months months months 1 year assets adjust- adjust- exposure
ments ments
A. On balance sheet exposures
a) Bad loans 9,876 (9,876)
– of which: forborne exposures
b) Unlikely to pay 12,098 (4,629) 7,469
– of which: forborne exposures
c) Non-performing past due exposures 2,868 (2,104) 764
– of which: forborne exposures
d) Performing past due exposures 76 (5) 71
– of which: forborne exposures
e) Other performing exposures 1,857,863 (617) 1,857,246
– of which: forborne exposures
Total A 24,842 1,857,939 (16,609) (622) 1,865,550
B. Off balance sheet exposure
a) Non performing
b) Other 42 42
Total B
Total A + B 24,842 1,857,981 (16,609) (622) 1,865,592
On-balance sheet exposures include all on-balance sheet financial assets claimed from customers,
irrespective of their portfolio of allocation.
1.8 On-balance sheet credit exposures to customers: changes in gross non-performing exposures
Bad loans Unlikely Non-performing
to pay past due
exposures
A. Initial gross exposures 6,853 12,500 5,991
– of which: exposures sold not derecognised
B. Increases
B.1 inflows from performing exposures
B.2 transfers from other non-performing exposure categories 3,090
B.3 other increases 178 72
C. Decreases
C.1 outflows toward performing exposures
C.2 write-offs
C.3 repayments (245) (402) (105)
C.4 credit disposals
C.5 losses from disposals
C.6 transfers to other non-performing exposure categories (3,090)
C.7 other decreases
D. Final gross exposures 9,876 12,098 2,868
– of which: exposures sold not derecognised
102
IOR
Annual report 2016
1.10 On-balance sheet non performing credit exposures to customers: changes in total adjustments
Reason / Categories Bad loans Unlikely to pay Non performing
past due exposures
Total of which: Total of which Total of which
forborne forborne forborne
exposures exposures exposures
A. Initial total adjustments 6,853 4,782 3,713
– of which: exposures sold not derecognised
B. Increases
B.1 impairment losses 762 691
B.2 losses on disposal
B.3 transfers from other non performing
exposure categories 2,290
B.4 other increases 258 53
C. Decreases
C.1 recoveries on impairment losses (153)
C.2 recoveries on repayments (287) (63)
C.3 profits on disposal
C.4 write-offs
C.5 transfers to other non-performing
exposure categories
C.6 other decreases (2,290)
D. Final total adjustments 9,876 4,629 2,104
– of which: exposures sold not derecognised
2 Classification of exposures based on external and internal ratings
2.1 Detail off and on-balance sheet credit exposures by external rating class
Exposures External rating classes
Class 1 Class 2 Class 3 Class 4 Class 5 Class 6 Unrated Total
A. On balance sheet exposures 623,780 697,578 1,588,979 10,277 20,873 121,544 3,063,031
B. Derivatives
B.1 Financial derivatives
B.2 Credit derivatives
C. Guarantees given 42 42
D. Commitments to lend funds
E. Other
Total 623,780 697,578 1,588,979 10,277 20,873 121,586 3,063,073
For the analysis of the credit risk of the borrowers / guarantors, the Institute use S&P rating; when
S&P are not available, the Institute utilizes the equivalent value from the Moody’s rating agency.
In the preparation of the above table S&P ratings have been used.
Below a reconciliation between risk classes and the S&P ratings:
Class 1 – from AAA to AAClass
2 – from A+ to AClass
3 – from BBB+ to BBBClass
4 – from BB+ to BBClass
5 – from B+ to BClass
6 – Others 103
IOR
Annual report 2016
3 Detail of guaranteed credit exposures by type of guarantee
3.2 Guaranteed credit exposures to customers
1.Guaranteed on balance
sheet credit exposures
1.1 totally guaranteed 451 451 451
– of which non performing
1.2 Partly guaranteed
– of which non performing
2. Guaranteed off-balance
sheet credit exposures
2.1 Totally guaranteed
– of which non performing
Partly guaranteed
– of which non performing
104
IOR
Annual report 2016
Total (1)+(2)
Other entities
Banks
Other Public Entities
Governments and Central
Banks
Other entities
Banks
Other Public Entities
Governments and Central
Banks
Credit Linked Notes
Other real guarantees
Securities
Real estate assets – financial lease
Real estate assets – mortgages
Net exposure
Real collateral (1) Guarantees (2)
Credit derivatives
Other derivatives
Credit commitments
5.2.4 Distribution and concentration of credit exposures
1. Detail by sector of on-balance and off-balance sheet credit exposures to customers (book value)
Due to the change in accounting system, the data for 2015 were too heavy to be extracted and barely
relevant in comparison to the information provided.
105
IOR
Annual report 2016
A. On balance sheet exposures
A.1 Bad loans 9,876
– of which
forborne exposures
A.2 Unlikely to pay 7,469 4,629
– of which
forborne exposures
A.3 Non-performing past
due exposures 764 2,104
– of which
forborne exposures
A.4 Performing exposures 8,290 1,354,046 237,021 9,286 239,360 9,315 622
– of which
forborne exposures
TOTAL A 8,290 1,354,046 237,021 9,286 239,360 17,548 16,609 622
B. Off-balance sheet exposures
B.1 Bad loans
B.2 Unlikely to pay
B.3 Other non-performing assets
B.4 Other exposures 42
TOTAL B 42
TOTAL (A+B) 2016 8,290 1,354,046 237,021 9,286 239,360 17,590 16,609 622
TOTAL (A+B) 2015
Net exposure
Individual adjustments
Portfolio adjustments
Net exposure
Individual adjustments
Portfolio adjustments
Net exposure
Individual adjustments
Portfolio adjustments
Net exposure
Individual adjustments
Portfolio adjustments
Net exposure
Individual adjustments
Portfolio adjustments
Net exposure
Individual adjustments
Portfolio adjustments
Net exposure
Individual adjustments
Portfolio adjustments
Net exposure
Individual adjustments
Portfolio adjustments
Net exposure
Individual adjustments
Portfolio adjustments
Public
Authorities
Domestic Foreign Public Sector Foreign Private Sector
Foreign Public
Authorities
Regional – Local
Public Authorities
International
Public Authorities
Other Public
Entities
Financial
companies
Insurance
companies
Non financial
companies
Other companies
2. Detail by geographical area of on- and off-balance sheet credit exposures to customers (book
value)
Exposures / Geographical areas Domestic European Countries America Asia Rest of the world
Net Total Net Total Net Total Net Total Net e Total
exposure adjustments exposure adjustments exposure adjustments exposure adjustments exposure adjustments
A. On balance sheet exposures
A.1 Bad loans 9,876 (9,876)
A.2 Unlikely to pay 12,098 (4,629)
A.3 Non performing past due exposures 2,868 (2,104)
A.4 Performing exposures 8,326 (2) 1,576,148 (615) 217,127 (2) 50,415 5,923 (2)
Total A 8,326 (2) 1,600,990 (17,224) 217,127 (2) 50,415 5,923 (2)
B. Off balance sheet exposures
B.1 Bad loans
B.2 Unlikely to pay
B.3 Other non-performing assets
B.4 Performing exposures 42
Total B 42
Total A+B 2016 8,326 (2) 1,601,032 (17,224) 217,127 (2) 50,415 5,923 (2)
Total A+B 2015
Due to the change in accounting system, the data for 2015 were too heavy to be extracted and barely
relevant in comparison to the information provided.
3. Detail by geographical area of on- and off-balance sheet credit exposures to banks (book value)
Exposures / Geographical areas Domestic European Countries America Asia Rest of the world
Net Total Net Total Net Total Net Total Net e Total
exposure adjustments exposure adjustments exposure adjustments exposure adjustments exposure adjustments
A. On balance sheet exposures
A.1 Bad loans
A.2 Unlikely to pay
A.3 Non performing past due exposures
A.4 Performing exposures 976,812 148,537 1,396 70,736
Total A 976,812 148,537 1,396 70,736
B. Off balance sheet exposures
B.1 Bad loans
B.2 Unlikely to pay
B.3 Other non-performing assets
B.4 Performing exposures
Total B
Total A+B 2016 976,812 148,537 1,396 70,736
Total A+B 2015
Due to the change in accounting system, the data for 2015 were too heavy to be extracted and barely
relevant in comparison to the information provided.
4. Large exposures
IOR has no large exposures as defined by art. 46 of AIF Regulation No. 1.
106
IOR
Annual report 2016
5.2.5 Securitisation
No securitisation transactions were made by the IOR.
5.2.6 Information on unconsolidated structured entities
For unconsolidated structured entities, the Institute considers the shares held in externally managed
investment funds.
For some external funds, the Institute is the owner of a significant number of shares, but does not
control these funds because, it does not participate in investment decisions, either directly or indirectly,
and it does not hold the ability to affect the returns of the above-mentioned funds.
The information required by IFRS 12 on the unconsolidated structured entities is below.
As of the balance sheet date, the Institute holds EUR 33.7m in investments in external funds in
its trading portfolio. Dividends collected in 2016 on such funds amount to EUR 812,000 (EUR
800,000 in 2015).
70% of the funds in the portfolio are closed-ended funds, and can be subscribed to only at given
times by specific parties, who, as mentioned, have no control and the remaining 30% of funds are
related to funds that can be subscribed to by different entities at any time and for any amount (openended
funds).
Conversely, with regard to their asset classes, funds held by the Institute invest in equity securities
(30%), debt securities (30%) and the real estate market (40%). Regarding geographical distribution,
the criteria used in the above mentioned table was used to separate funds based on their legally
registered domicile.
According to those criterion, all of the funds are located within the European Union.
107
IOR
Annual report 2016
2016 2015
Balance sheet exposure Balance sheet exposure
Nominal Value Carrying amount Nominal Value Carrying amount
Investment Fund type
Open-end fund 75,160 10,404 38,499 5,387
Closed-end fund 20,170,677 13,333 20,170,677 23,357
Hedge fund
Exchange traded fund
Unit Investment Trust
Fund of fund 2,300 9,944 2,300 12,585
Seed Fund
Total 20,248,137 33,681 20,211,476 41,329
Underlying asset class focus
Equity 2,300 9,944 2,300 12,585
Debt 75,160 10,404 38,499 5,387
Asset Allocation
Money Market
Real Estate 20,170,000 13,311 20,170,000 23,333
Commodity
Alternative Investments 677 22 677 24
Total 20,248,137 33,681 20,211,476 41,329
Geographical Area
UE 20,248,137 33,681 20,211,476 41,329
USA
Total 20,248,137 33,681 20,211,476 41,329
At the balance sheet date, the IOR did not provide any guidance to unconsolidated structured entities
on their investment policies. The Institute has not sponsored any unconsolidated structured
entities.
At the balance sheet date, the Institute had a standing commitment to one of these funds to third
parties of EUR 4m.
SGIR is 100% owned by IOR.The Institute does not prepare consolidated financial statements because
the resulting information would not be relevant to the readers of the financial statements.The
total balance sheet assets of the subsidiary are insignificant when compared with those of the Institute
and, accordingly, the consolidated financial statements would not differ significantly from
these financial statements.
5.2.7 Models for the measurement of credit risk
For the credit risk measurement, the Institute adopted the standard methodology defined by AIF
Regulation No. 1, articles 63-89. No individual and portfolio internal models are used.
5.3 Market risks
Format and content of information on market risk and relative hedging policies
108
IOR
Annual report 2016
5.3.1 Interest rate risk and trading portfolio price risk
5.3.1.1 General aspects
Interest rate risk related to the trading portfolio is derived from the Institute’s trading activity in
financial instruments, simple and complex, exchanged on organized markets and over-the-counter
markets, put in place by the Treasury department. This risk pertains to positions in bonds, particularly
those based on a fixed rate, the value of which is closely linked to the trend in interest rates.
In line with the objectives of the Treasury Department in liquidity management and capital, and
in line with the Institute’s threshold for risk, the level of risk in the trading portfolio is rather low,
as indicated by the short holding period (1.37 years). In anticipation of an increase in interest rates,
the Institute has further reduced the overall holding period in order to mitigate any negative impact
on the value of the portfolio.
Price risk comes from the exposure on equity securities, ETF and funds. The Institute reduced the
threshold for such risk and exposures come mainly from the need to obtain a diversified return on
own equity, in a period characterized by low interest rates.
5.3.1.2 Operating procedures and methods for measuring interest rate risk and price risk
Interest rate risk and price risk are measured and managed as part of the overall management and
monitoring of risk.
Market risk is the risk of change in portfolio value from adverse fluctuations in market parameters,
such as interest or currency rates, equity prices or prices of commodities underlying derivative contracts.
The Institute’s trading portfolio is comprised mainly of bond securities, and the main associated
risks are interest rate and LIBOR spread variation risk, as further described in the next paragraphs.
The power to assume market risk lies with the Directorate, which plays an active role in risk management
and monitoring, according to the guidelines issued by the Board of Superintendence.
Specifically, the Director General delegates the assumption of market risk and management to the
Treasury department that operates autonomously in accordance with the limits assigned to the department.
Market risk assumption and management is separate from the confirmation, settlement, matching
and execution (Back Office) and of the Risk Management department.
At 31 December 2016, the Institute did not hold quoted derivatives. A project analysing future interest
rates is being performed, with the goal of providing an instrument for hedging the interest
rate risk of the bond portfolio.
The system of measurement of financial risks and the establishment of operational limits of the Institute
are based on the use of statistic calculation tools. Specifically, the three measures of potential
loss are: Value at Risk, Expected Shortfall and Stress Test. These measures are defined as follows:
• Value at Risk (VaR) is defined as the maximum loss that the Institute could withstand, with
probability equal to predetermined confidence levels, in the case of adverse market trends to
the position taken;
• Expected Shortfall is defined as the average loss that the Institute could withstand in case of a
VaR overrun;
• StressTest is defined as the loss that the Institute could withstand in case of negative events impacting
main risk indicators (equity prices and indexes, interest rates, currency rates, credit
spread) analyzed independently and as established by the RAF. 109
IOR
Annual report 2016
In addition to the aforementioned measures, the Institute utilises an indicator of realized losses on
a 10-day time horizon, defined as the sum of the negative results realized on closed positions and
unrealized losses on open positions, valued at market, with reference to the last five working days.
The VaR and the Expected Shortfall are calculated using the historic method (at least one year of
data and quarterly update of the scenarios), with a daily timeline and confidence level at 99%.
The StressTests are calculated by simulating extreme scenarios of the main risk factors, starting from
the worst movements recorded in the history of the world’s financial markets, as further described
in the following paragraphs. In particular:
• for interest rate risk, the variations in interest rates that make up the market curve, the rate
volatility risk and correlation risk. On a daily basis, stress test analyses are conducted on the rates
curve, assuming substantial shifts of the curve (-40% / +50% with a floor equal to 50 basis
points);
• for LIBOR spread variation risk, the stress scenarios consider increases depending on the absolute
spread level: more precisely, these are set equal to -20/+40 bps for securities with a spread
lower than Libor, -40/+80 bps for securities with a spread between 0 and 100 bps and –
40%/+80% of the spread for securities with a spread above 100 bps;
• for price risk, different categories of instruments are adequately presented: equities securities,
equities indexes, funds and ETF. A stress test analysis is then conducted, applying the defined
scenarios to spot prices (from -30% to +30%).
Monitoring compliance with limits on a daily basis is performed by the Risk Management department,
which provides daily updates to the Directorate on the level of risk assumed and compliance
with operational limits.
When operational limits have been exceeded, the Risk Management department promptly informs
the Directorate of the overrun and the Director General decides on the appropriate action.
In establishing a system of market risk measurement, definition of operational limits, and the monitoring
of compliance with the limits, the Director General is supported by the Risk Committee,
who serves as an advisor on the following matters:
• assignment and review limits for of VaR, Expected Shortfall, Stress Test and WCL to the Treasury
department;
• assignment of additional limits, determined based on nominal sensitivity factor (portfolio sensitivity
to the single risk factors), etc;
• periodical trend analysis of the Institute’s risk position and identification of the root causes of
the unusual trends;
• monitoring risks assumed and compliance with the pre-established limits;
• total or partial disruption of the activities in certain sensitive financial instruments to risk factors;
• analysis of the ordinary and extraordinary events, following particular market turbulences and
macroeconomic scenarios.
During 2016 the Institute maintained a prudential approach in the management of financial risks.
Specifically, during the year, the held for trading portfolio had a daily average VaR of EUR 4.92m,
a daily maximum VaR of EUR 6.2m and a daily minimum VaR of EUR 3.72m; the operational
limits calculated on 10 working days, determined as EUR 25m under RAF, was never exceeded.
At the end of 2016, the VaR amounted to EUR 11.0m. The portfolio only contained highly liquid
products.
The Risk Management department, to verify the adequacy of the VaR calculation, periodically con- 110
IOR
Annual report 2016
ducts retrospective reviews, comparing the actual trading results achieved, with the VaR measures
previously calculated. During 2016, the Institute did not identify events where actual daily losses
exceeded the risk measures expressed in terms of VaR on a daily basis.
The potential impact of a shock of +/- 100 basis point on the portfolio held for trading could have
an impact of EUR 24.9m, representing 56.49%, 69.19% and 3.70% of interest margin, profit for
the year and equity, respectively.
Stress test data at the end of 2016 shows, for interest rate risk, an exposure equal to EUR 12.7m
for a variation of +50% of interest rates, with a minimum variation of 50 basis points; the exposure
is focused on the EUR rate risk for 70% and on USD rate risk for the remaining 30%.
The management and monitoring of risk is continuously improving, and the project related to implementation
of the new system by theTreasury department is under completion; when completed,
the project will allow:
• monitoring of positions, profits and risks real time (automatic feed of main risk parameters and
continuous revaluation of the position, calculation of the VaR position at any time of the day);
• possibility of monitoring P&L trend and risks in different aggregation levels, from the single
instrument, to the entire position of the Treasury department.
2.1 Trading portfolio: detail by maturity date (re-pricing date) of financial assets and liabilities on
balance sheet and financial derivatives
Type / Expiration date On Up to 3 3-6 6-12 1-5 5-10 Over Non
demand months months months years years 10 years defined
A. Cash assets
1.1 Debt securities
– with early redemption option 70,199 3,392
– other 729,708 295,561 80,132 589,870 55,488 515
1.2 Other assets
2. Cash liabilities
2.1 Repurchase agreements
2.2 Other liabilities
3. Financial derivatives
3.1 With underlying security
– Options
+ Long positions
+ Short positions
– Other derivatives
+ Long positions
+ Short positions
3.2 Without underlying security
– Options
+ Long positions
+ Short positions
– Other derivatives
+ Long positions
+ Short positions
111
IOR
Annual report 2016
2.2 Trading portfolio: detail of equity securities and index exposures for the main countries quoted
markets
Type / Quotation index Quoted
Italian NYSE Xetra New NASDAQ Other Non
Stock Arca York GS quoted
Exchange
A. Equity securities
– long positions 23,002 10,515 7,441 3,833 3,330 4,609
– short positions
B. Transactions not yet settled on equity securities
– long positions
– short positions
C. Other derivatives on equity securities
– long positions
– short positions
D. Derivatives on equity index
– long positions
– short positions
With reference to price risk of other financial instruments classified as held for trading, at the end
of 2016, the Institute’s portfolio had the following exposure:
• Closed-end funds EUR 23,3m;
• Open-end funds EUR 10,4m.
112
IOR
Annual report 2016
5.3.2 Interest rate risk and price risk of other financial instruments in portfolio
2.1 Other financial instruments in portfolio: detail by expiration date (re-pricing date) of
financial assets and liabilities
Type / Expiration date On Up to 3 3-6 6-12 1-5 5-10 Over Non
demand months months months years years 10 years defined
1. Cash assets
1.1 Debt securities
– with early redemption option 10,020
– other 24,280 231,679 75,436 168,784 48,757
1.2 Loans to banks 457,624 100,006 60,548 25,052
1.3 Loans to customers
– current accounts 8,452
– other loans
– with early redemption option 13,527
– other 7,174
2. Cash liabilities
2.1 Due to customers
– current accounts 2,397,688
– other liabilities
– with early redemption option
– other 855 382
2.2 Due to banks
– current accounts
– other liabilities
2.3 Debt securities
– with early redemption option
– other
2.4 Other liabilities
– with early redemption option
– other
3. Financial derivatives
3.1 With underlying security
– Options
+ Long positions
+ Short positions
– Other derivatives
+ Long positions
+ Short positions
3.2 Without underlying security
– Options
+ Long positions
+ Short positions
– Other derivatives
+ Long positions
+ Short positions
4. Other off balance sheet transactions
+ Long positions
+ Short positions
Regarding interest rate risk for financial instruments other than those classified as trading, the Institute’s
exposure refers mainly to the assets classified as held to maturity and to interbank deposits,
already listed in the paragraph related to credit risk. 113
IOR
Annual report 2016
The application of a variation of interest rates of +/- 100 basis points to the portfolio, including
other financial instruments (EUR 559m) shows a potential impact of EUR 8.65m, representing
19.62%, 24.03% and 1.29% of interest margin, profit for the year and equity, respectively.
With reference to price risk of financial instruments not classified as trading, at the end of 2016,
the Institute’s portfolio had the following exposure:
• Financial assets available for sale EUR 6,7m;
• Investment in subsidiaries SGIR S.r.l. EUR 15,8m.
Regarding the limits, the Board of Superintendence established limits for the investment in financial
assets held to maturity in relation to equity. For this portfolio a measure of VaR is also calculated
(respectively EUR 0.74m, 0.97m and 2.23m of minimum, medium and maximum daily
value), but not associated with limits.
5.3.3 Currency risk
General aspects, operating procedures and methods for measuring currency risk
Currency risk is the risk that the Institute can incur losses on the portfolio held for trading due to
the adverse variation of currency rates and the price of gold. As mentioned above, the management
of currency risk is based on the system in place for the management of financial risks.
For the currency rate, as it was for interest rates, the following pre-defined StressTest scenarios were
used for each currency providing shock higher for minorcurrencies and for those not related to Euro.
The potential impact of these shocks could result in loss of approximately EUR 2.8m.
2.1 Detail by currency of financial assets, liabilities and derivatives
Currencies
USD GBP CAD AUD CHF Other
Items currencies
A. Financial assets
A.1 Debt securities 581,767 2,373 471 1,894 3,986 226
A.2 Equity securities 31,189 684 7 6
A.3 Loans to banks 55,625 16,320 8,716 7,237 146 6,123
A.4 Loans to customers 17
A.5 Other financial assets 7,561 127 959 353 1,145 1,173
B. Other assets 21,715
C. Financial liabilities
C.1 Due to banks
C.2 Due to customers 664,165 13,213 5,036 7,007 9,506 2,414
C.3 Debt securities
C.4 Other financial liabilities 3,049 42 907 2 5
D. Other liabilities
E. Financial derivatives
– Options
+ Long positions
+ Short positions
– Other derivatives
+ Long positions
+ Short positions
Total Assets 697,874 19,404 10,146 9,484 5,284 7,528
Total Liabilities 667,214 13,255 5,943 7,009 9,511 2,414
Difference (+/-) 30,660 6,149 4,203 2,475 (4,227) 5,114 114
IOR
Annual report 2016
The exchange rate risk exposure resulting from the application of the abovementioned stress tests
of 100 basis point at 31 December 2016 resulted in an amount equal to EUR 0.45m, representing
1.02%, 1.25% and 0.07% of interest margin, profit for the year and equity, respectively.
For capital requirement calculation related to currency risk, the IOR adopted the standard methodology
provided by AIF Regulation No. 1.
5.3.4 Derivative instruments
In 2016 IOR did not hold derivative financial instruments.
5.4 Liquidity risk
Format and content of information on liquidity risk and relative hedging policies
5.4.1 General aspects, operating procedures and methods for measuring liquidity risk
Liquidity risk is the risk that the Institute will encounter difficulties in meeting payment obligations
by cash or by expected or unexpected delivery, compromising the daily operations or the financial
situation.
Regarding liquidity risk, during 2016, the IOR did not encounter any notable problems: starting
from January 2016, the liquidity risk measurement methodologies have been defined according to
the provisions of AIF Regulation No. 1; the liquidity risk indicator (LCR), calculated over a period
of 30 days, resulted in a value equal to 395.4%, well above the regulatory limit of 200% established
by RAF. It is important to note that Institute liabilities are represented, other than equity,
by deposits from customers, mainly on demand. Moreover the Institute does not carry out funding
transactions on the interbank market or on the capital market.
From an organizational standpoint, the Institute’s liquidity risk is managed by theTreasury Department
which monitors the expected and realized flows in currencies and maintains an adequate portfolio
of liquid assets to meet any unexpected payments.
Monitoring of liquidity and adherence to liquidity operating limits are performed daily by the Risk
Management Department.
The following tables show the Institute’s assets and liabilities with current values, divided by contractual
maturities of the financial liabilities and the expected maturities of the financial assets. The
first table includes only financial assets and liabilities in Euro, while the second table comprises only
financial assets and liabilities in other currency than Euro.
115
IOR
Annual report 2016
1.1 Detail by contractual residual maturity of financial assets and liabilities in Euro
On 1-7 7-15 15-30 1-3 3-6 6-12 1-5 Over 5 Non
Type / Residual maturity demand days days days months months months years years defined
Cash assets
B.1 Government bonds 31 5,457 52,298 151,027 166,128 939,595
B.2 Other debt securities 1 7,820 13,416 20,008 204,681 136,914 480,608
B.3 UCI units 33,681
B.4 Loans
– Banks 363,455 80,000 20,006 60,548 25,052
– Customers 8,436 37 7 57 3,980 4,857 11,762
Cash liabilities
B.5 Deposits and current accounts
– Banks
– Customers 1,697,582
B.6 Debt securities
B.7 Other liabilities
Off balance sheet transactions
B.8 Financial derivatives with
exchange of capital
– long positions
– short positions
B.9 Financial derivatives without
exchange of capital
– long positions
– short positions
B.10 Deposits and loans to be settled
– long positions
– short positions
B.11 Irrevocable commitments to
lend funds
– long positions
– short positions
B.12 Financial guarantees given
B.13 Financial guarantees received
B.14 Credit derivatives with
exchange of capital
– long positions
– short positions
B.15 Credit derivatives without
exchange of capital
– long positions
– short positions
116
IOR
Annual report 2016
1.2 Detail by contractual residual maturity of financial assets and liabilities in other currency than
Euro
On 1-7 7-15 15-30 1-3 3-6 6-12 1-5 Over 5 Non
Type / Residual maturity demand days days days months months months years years defined
Cash assets
B.1 Government bonds 159 1 27 331 25,906 61,607 3,339
B.2 Other debt securities 89 161 12,243 25,870 9,221 30,114
B.3 UCI units
B.4 Loans
– Banks 94,168
– Customers 17
Cash liabilities
B.5 Deposits and current accounts
– Banks
– Customers 700,105 649 206 382
B.6 Debt securities
B.7 Other liabilities
Off balance sheet transactions
B.8 Financial derivatives with
exchange of capital
– long positions
– short positions
B.9 Financial derivatives without
exchange of capital
– long positions
– short positions
B.10 Deposits and loans to be settled
– long positions
– short positions
B.11 Irrevocable commitments
to lend funds
– long positions
– short positions
B.12 Financial guarantees given
B.13 Financial guarantees received
B.14 Credit derivatives with
exchange of capital
– long positions
– short positions
B.15 Credit derivatives without
exchange of capital
– long positions
– short positions
5.5 Operational risk
Format and content of information on operational risk and relative hedging policies
5.5.1 General aspects, operating procedures and methods for measuring operational risk
Operational risks represent the risk of loss caused by inadequate and failure of processes, human
resources and internal system, or caused by external events.
Operational risk does not include strategic and reputational risks, but includes legal risk, which is 117
IOR
Annual report 2016
the risk of loss from violations of laws and regulations, contractual or non-contractual liability, or
other disputes.
Operational risks include, among other things, administrative risk (for example, absence or inadequacy
of line controls), human resources risk (for example, a lack of professional training for staff),
and IT risk (for example, inadequacy of the computer system that could cause loss of data or interruption
of operations).
The Institute is defining a framework for operational risk management, establishing the organizational
processes for measurement, management and control of that risk. More specifically, the risk
assessment framework for the Institute’s activities provides an assessment of the operational risk of
each process (unmitigated risk), a verification of the tools for monitoring and mitigation of this risk
and an assessment of the residual risks (mitigated risk).
Definition of a framework for the recognition of operational risk events is also under analysis, which
will include an Institute database which such events and the mitigating actions taken will be input.
“Operational risk event” is an event of any nature that “potentially” may generate a loss for the
Institute, and not only events that have caused an actual loss. Generally, these events do not generate
losses, but it is important to record them to highlight possible areas of exposure to a high number
of events.The Institute has to take action with regard to these events with organizational changes
(when there are problems with the processes), technological changes (when there are technical problems)
and/or training changes (when there are problems related to human errors). This activity allows
the Institute to mitigate the risk that these events, if repeated in the future, can generate real
losses.
For compliance with the Regulation No. 1, the business lines will be directly involved in the Operational
Risk Management process, through the establishment of specifically in the collection and
classification of data about events that have generated operating losses, and the risk assessment associated
with the operating environment.
From an organizational point of view, the monitoring of the Institute’s operational risks will be managed
by an Operational Risk Management (ORM) unit, located within the IOR Risk Management
department.The ORM will be responsible for development of methodologies for risk measurement
and the processing of loss data, and will also responsible for the preparation of reporting tools.
The ORM will promptly inform the Directorate of the most significant operational events, and will
prepare a periodical report analyzing the trend in operational risks, events that have occurred, and
the actions taken to resolve the main critical issues.
Extraordinary losses and operating losses have been recorded during 2016 for a total amount of EUR
729,000, of which around EUR 250,000 related to external transactions not authorized (credit cards
and payment services). In this regard, corrective measures have been taken to prevent such events
from happening again in the future. In addition, negative accounting reconciliation was recorded
for approximately EUR 386,000 related to the customers assets (or securities) deposited with third
parties, of which the Institute decided to cover. Finally, there is a provision to risks and charges item
amounting to EUR 3.5m related to probable contingencies related to tax issues towards foreign
countries, decreasing from the previous year.
118
IOR
Annual report 2016
PART 6. INFORMATION CONCERNING EQUITY
6.1 Shareholders’ Equity
6.1.1 Qualitative information
The Institute’s equity represents capital funding provided by the owner or generated by the business
to create value.
In managing capital (a broader concept than “equity” presented in the balance sheet and consistent
with regulatory capital, which is not comprised solely of equity in the strict sense), the Institute’s
objectives are:
• to safeguard the Institute’s ability to continue as a going concern, so that it can continue to provide
benefits for all stakeholders;
• to maintain a strong capital base to support business growth.
The Institute pursues its objectives of capital management during the planning processes, through
the analysis of risks associated with planned activities, and during the monitoring processes through
the analysis and monitoring compliance with limits.
In managing capital, the Institute observes regulatory capital requirements established by the regulatory
framework related to prudential supervision.
6.1.2 Quantitative information
1 Detail
2016 2015
1. Capital 300,000 300,000
2. Reserves
(a) Earning reserves
(i) Unavailable 100,000 100,000
(ii) Available 282,134 282,134
(iii) Other
(b) Other
3. Equity instruments
4. Valuation reserves
(a) Available for sale assets 499 4.777
(b) Tangible assets
(c) Intangible assets
(d) Hedging of foreign investments
(e) Cash flows hedging
(f) Exchange differences
(g) Non current assets held for sale
(h) Actuarial gains (losses) on defined benefit plans (46,034) (32,759)
(i) Share of valuation reserves connected with investments carried at equity
5. Profit (loss) for the year 36,001 16,127
Total 672,600 670,278
Capital, clearly identified as a component of Equity, represents a permanent endowment that cannot
be reduced or distributed, except in case of cessation or liquidation of the entity. 119
IOR
Annual report 2016
Unavailable Reserves are profit reserves designed to further strengthen theInstitute’s Equity and longterm
stability.
Available or “distributable” Reserves are earnings available for distribution, subject to a resolution
of the Commission of Cardinals.
Fair Value Reserves for available for sale securities represents the net fair value gain/loss recognized
on investment securities classified as available for sale.
Post-employment benefit actuarial gain (loss) Reserves represents the actuarial unrealised gain or
loss related to the post-employment benefit plans.
2 Fair value reserve of financial assets available for sale: detail
2016 2015
Positive Reserve Negative Reserve Positive Reserve Negative Reserve
1. Debt securities
2. Equity securities 499 4,777
3. UCI units
4. Loans
Total 499 4,777
3 Fair value reserve of financial assets available for sale: annual changes
Debt securities Equity securities UCI units Loans
1. Opening balance 4,777
2. Positive changes
2.1 Fair value increases 112
2.2 Reclassification from negative
reserves to the Income statement:
From Impairment 148
From disposal
2.3 Other changes
3. Negative changes
3.1 Fair value decreases (1,949)
3.2 Impairment
3.3 Reclassification from positive
reserves to the Income statement:
From disposal (2,589)
3.4 Other changes
4. Closing balance 499
4 Valuation reserves related to defined benefit plans: annual changes
Defined benefit plan
1. Opening balance (32,759)
2. Positive changes
2.1 Post-employment benefit actuarial gain of the year
3. Negative changes
3.1 Post-employment benefit actuarial loss of the year (13,275)
4. Closing balance (46,034)
120
IOR
Annual report 2016
6.2 Own equity and prudential supervision ratios
1 Own equity
2016 2015
A. Positive components
1. Capital 300,000 300,000
2. Supplemental Capital
Retained earnings
(i) Unavailable 100,000 100,000
(ii) Available 282,134 282,134
(iii) Others
Provisions
Reserves (45,535) (27,981)
3. Positive prudential filter IAS/IFRS
B. Negative components
1. Goodwill
2. Intangible assets (1,044) (875)
3. Impairments on loans
4. Losses recognized in previous years and in current year
5. Regulatory downs of assets carried at fair value
6. Negative prudential filter IAS/IFRS (250) (2,389)
Common Equity 635,305 650,888
Capital is defined by AIF Regulation No.1 art. 3 (8) as the initial funding or subsequent integration
of capital by the Holy See or the Vatican City State.
a. it is paid in pursuant to the legislation of the Holy See and the Vatican City State;
b. it is clearly and distinctly identified in the financial statements;
c. it cannot be reduced or distributed, except in the case of cessation or liquidation of the entity,
ensuring that it is distributed proportionality to legitimate creditors, according to the legislation
of the Holy See and the Vatican City State and acquired by the Apostolic See.
For regulatory purposes, the term “Capital” shall be considered as equivalent to “core capital”.
The Supplemental Capital is defined under AIF Regulation No. 1 art. 3 (68) as the sum of retained
earnings, accumulated as other comprehensive income and other reserves.
The Common Equity is defined under Regulation No. 1, art. 3 (12) as:
– the sum of the following positive components:
a. the Capital;
b. the supplemental capital;
– deducting the following components (if negative):
a. goodwill;
b. intangible assets;
c. adjustments to the value of receivables;
d. losses recognized in previous financial periods and in the current period;
e. adjustments to the regulatory value of assets valued at their “fair value”.
For regulatory purposes, “common equity” shall be considered as equivalent to “common equity
tier 1”.
Regulatory capital consists of common equity and is calculated by the Institute on a monthly basis,
although only required to be calculated by the Supervisory Authority quarterly. 121
IOR
Annual report 2016
As required, the amount of annual and half-yearly earnings, excluding the amounts that can potentially
be allocated to dividends, contributes to the calculation of regulatory capital for the months
of December and June.
The Common Equity at the end of 2016 amounted to EUR 635.3m (2015: EUR 650.9m).
Considering the items comprising the Institute’s equity, the sole prudential filter in common equity
at 31 December 2016 is associated with the positive fair value reserve relating to the investment
securities held in the Available for Sale portfolio. This reserve is computed using a negative
prudential filter, for an amount equal to 50%.
In the calculation of the Regulatory Capital 2016, the Net profit for the year not included, as it is
considered fully distributed.
6.2.2 Capital adequacy
The monitoring of key ratios is performed daily by the Risk Management Department, in order
to continuously monitoring compliance with regulatory requirements. The table below shows the
data relating to capital requirements at the end of 2016 and at the end of 2015 for comparison.
In order to allow a correct comparison, the 2015 figures have been restated to take account the Authority’s
latest notes regarding the weighting of some risks.
Unweighted amounts Weighted amounts/
Capital requirements
2016 2015 2016 2015
A. Risk asset
A.1 Credit and counterparty risk
1. Standardised approach 1,333,514 1,533,600 360,173 457,872
2. Approach based on internal ratings
2.1 Based
2.2 Advanced
3. Securitizations
B. Capital requirements
B.1 Credit and counterparty risk 28,814 36,630
B.2 Credit valuation adjustment risk
B.3 Settlement risk
B.4 Market risk
1. Standardised approach 40,245 39,814
2. Internal model
3. Concentration risk
B.5 Operational risk
1. Basic indicator approach 9,699 9,405
2. Standardised approach
3. Advanced approach
B.6 Other calculation elements
B.7 Total capital requirements 78,758 85,849
C. Risk weighted assets and capital ratios
C.1 Risk-weighted assets 984,472 1,073,116
C.2 Capital/ Risk-weighted assets 30.47% 27.96%
C.3 Common equity/Risk-weighted assets 64.53% 60.65%
122
IOR
Annual report 2016
PART 7. RELATED PARTY TRANSACTIONS
Related parties of the Institute include key management personnel (Directorate and Board of Superintendence),
the Commission of Cardinals and the Revisori.
Transactions with these related parties relate to salaries and remuneration
Details of key management compensation
Compensation due to related parties were EUR 647,000 in 2016, of which EUR 203,200 was not
yet paid as of 31 December 2016. Specifically, these expenses relate to:
• EUR 264,500 for the Board of Superintendence of which EUR 120,000 has not yet been paid;
• EUR 299,300 for the Directorate;
• EUR 83,200 for the Revisori, completely paid.
These amounts are recognized in the Income Statement as Operating Expenses.
Related-party transactions
During 2016, no transactions with key management were entered into, except for the management
of the deposit accounts opened with the Institute and salaries and remuneration discussed above.
As of the balance sheet date, the balance of deposits by the members of the Commission of Cardinals
was EUR 3.4m.
Key management personnel and Revisori had deposits totaling EUR 610,000.
The Institute has a long-term zero-interest loan to its subsidiary SGIR S.r.l., amounting to EUR
3.3m. In October 2015, the Institute signed the loan for the use of 4 real estate properties at no
cost with its subsidiary SGIR S.r.l. During 2016, SGIR S.r.l. did not earn rental income on these
properties.
123
IOR
Annual report 2016
REPORT OF THE REVISORI
To the Board of Superintendence
of the Institute
In this report, drawn up in accordance with Article 28 of the Statute, the Board of Auditors
of the Institute (the “Institute” or the “IOR”) remarks on the annual financial statements,
the report and the supporting documents, as prepared by the Directorate for the
financial year 2016.
In performing its work, the Board has responded to the Holy Father’s venerable invitation,
expressed in his letter of 30 January 2017, to apply “determination in observing the
statutory requirements”. This invitation follows the ethical path already demarcated by
His Holiness at the meeting of November 2015, where it was indicated that the Board
of Auditors should “act with due impartiality and independence”.
During the financial year, the Board of Statutory Auditors convened periodically to perform
its duties and attended, upon invitation, all the meetings of the Board of Superintendence.
The meetings of the Board of Auditors were characterized by intense work sessions and
benefited from the members’ diverse skills as well as the solid support of the President,
the Directorate and, where necessary, the Institute’s Administration and Control Functions.
The Board also noted that in 2016, through the provision of dedicated services, the Institute
confirmed its commitment to serving the Holy Father in the fulfilment of his mission
as universal pastor.
Activities carried out in compliance with the Statute’s provisions
The Board reports that, in accordance with Article 27 of the Statute, during 2016 it carried
out the audits of treasury assets falling within its jurisdiction, as well as the administrative
and accounting review of the books and accounts, also by obtaining information
from the heads of the internal control functions, and has no remarks to make in this respect.
IOR
Annual report 2016
127
At the specific request of the Board of Superintendence, the Board of Auditors also carried
out internal reviews and other checks.
In relation to these activities, the Board notes that the Board of Superintendence instructed
certain Board members to take part in a working group in order to draft the Internal Regulations
of the Institute, in accordance with the requirements set out under Articles 3,
17 and 24 of the Statute, also taking into account the recommendations made by the Holy
Father during his intervention at the Board of Superintendence meeting of 24 November
2015.
2016 financial statements
Pursuant to Article 28 of the current Statute, the Board of Auditors of the Institute examined
the 2016 financial statements (“Financial Statements”) and the Management Report.
The Financial Statements were drawn up in accordance with the Circular on the Preparation
of the Annual Financial Statements and Consolidated Financial Statements of Entities
carrying out Financial Activities on a Professional Basis, issued by the Financial Information
Authority on 15 December 2016.
Since this is the first financial year to which these new drafting principles have been applied,
the financial data for 2015 have also been reclassified in accordance with the provisions
laid down in the Circular, to make a comparison possible.
The Financial Statements are made up of the following:
• Balance Sheet;
• Profit and Loss Statement;
• Comprehensive Profit and Loss Statement;
• Statement of Cash Flows;
• Statement of Changes in Equity.
The Annual Report includes the above documents as well as a description of the Institute’s
activities, a summary of the accounting policies as well as the risks and uncertainties
linked to the use of estimates, the explanatory notes to the Financial Statements, and
financial risk information prepared in accordance with the Vatican rules on prudential
supervision.
128
IOR
Annual report 2016
129
IOR
Annual report 2016
The Financial Statements may be summarised as follows:
EUR000
BALANCE SHEET
Total assets 3,268,890
Total liabilities 2,596,290
Net assets 672,600
PROFIT AND LOSS ACCOUNT
Net result from financial activities 42,762
Net operating profit 36,001
Profit available for distribution 36,001
The Financial Statements have been audited by Deloitte & Touche S.p.A., which expressed
a clean and unqualified opinion on 26 April 2017.
Based on the audits that have been performed, and taking into account the conclusions
drawn by the internal control functions and the audit firm’s unqualified opinion, this
Board of Auditors:
• is in favour of the approval of the 2016 financial statements (Financial Statements) included
in the Annual Report, as prepared by the Directorate;
• agrees with the proposed allocation of the net operating profit.
Vatican City State, 26 April 2017
The Board of Statutory Auditors
Mario Busso Giovanni Barbara Luca Del Pico
This report has been translated into the English language solely for convenience of international
readers.
REPORT OF THE EXTERNAL AUDITORS
IOR
Annual report 2016
133
134
IOR
Annual report 2016
135
IOR
Annual report 2016
Printing
Iger & Partners S.r.l.
Rome – Italy
june 2017
http://www.ior.va/content/dam/ior/documenti/rapporto-annuale/IOR-Annual%20Report%202016.pdf
Le Pape François a confirmé pour un quinquennat le Cardinal Jean-Louis Tauran comme Membre de la Commission cardinalice de surveillance sur l’Institut pour les oeuvres de religion et nommé pour un quinquennat comme membres de la Commission cardinalice de surveillance sur l’Institut pour les oeuvres de religion:
le Cardinal Christoph Schönborn (Autriche),
le Cardinal Thomas Christopher Collins (Canada),
le Cardinal Santos Abril y Castelló (Archiprêtre de Ste.Marie Majeure),
et Mgr.Pietro Parolin (Secrétaire d’État).
-
François de Siebenthal: Vatican: les fumées de Satan en économie …
desiebenthal.blogspot.com/…/vatican-les-fumees-de-satan-en-economie.h…13 mai 2012 – Vatican: les fumées de Satan en économie et dans la vie. Le combat est analogue pour les plus pauvres dans les domaines économiques et …
-
François de Siebenthal: Fumées de Satan au Vatican ?
desiebenthal.blogspot.com/2012/05/fumees-de-satan-au-vatican.html11 mai 2012 – En publiant une lettre ouverte à propos de récents incidents qui se sont produits lors d’événements organisés par l’Académie pontificale pour …
-
François de Siebenthal
desiebenthal.blogspot.com/Il y a 19 minutes – La banque du Vatican, le bâtiment arrondi ci-dessus, l’Institut pour les … François de Siebenthal: Faux lingots au tungstène, folie sur l’or .
-
François de Siebenthal: Le président de la banque du Vatican …
desiebenthal.blogspot.com/…/le-president-de-la-banque-du-vatican.html25 mai 2012 – Le président de la Banque du Vatican, l’Institut pour les oeuvres religieuses (IOR), Ettore Gotti Tedeschi, a remis sa démission a annoncé jeudi …
-
François de Siebenthal: Crise: Le document du Vatican irrite le …
desiebenthal.blogspot.com/…/crise-le-document-du-vatican-irrite-le.html11 nov. 2011 – “L’Osservatore Romano” le massacre. Désormais tout nouveau texte du Vatican devra obtenir l’autorisation du cardinal avant d’être publié
-
François de Siebenthal: Vatican: Le cœur de la crise spirituelle et …
desiebenthal.blogspot.com/2012/…/vatican-le-cur-de-la-crise-spirituelle.h…25 mai 2012 – Le cœur de la crise qui meurtrit l’Europe, crise spirituelle et morale », est que « l’homme prétend avoir une identité accomplie simplement par …
-
François de Siebenthal: Vatican: Scandales mêlant banquiers …
desiebenthal.blogspot.com/2012/05/vatican-suites.html26 mai 2012 – Des documents confidentiels ont été communiqués à des médias italiens par une taupe du Vatican surnommée “Maria”. Un livre a été publié, …
-
François de Siebenthal: Vatican: le scandale des jours fériés
desiebenthal.blogspot.com/2012/…/vatican-le-scandale-des-jours-feries.h…27 mai 2012 – Portugal: Un accord est intervenu avec le Vatican, pour supprimer deux jours fériés religieux : finis, donc, la Fête-Dieu, 60 jours après Pâques, …
-
François de Siebenthal: U.E. La racine de tous les maux
desiebenthal.blogspot.com/2013/08/ue-la-racine-de-tous-les-maux.html18 août 2013 – 2013 – Le système bancaire à coupé les vivres au Vatican, plus de cartes … lui a fait perdre 1 170 000 euros entre le début et la fin de cette …
-
François de Siebenthal: IOR. Catholiques, balayons devant notre …
desiebenthal.blogspot.com/…/catholiques-balayons-devant-notre-porte.ht…1 oct. 2013 – La banque du Vatican, le bâtiment arrondi ci-dessus, l’Institut pour les œuvres de religion (IOR), a quadruplé son bénéfice net en 2012 par …
-
François de Siebenthal: The Rubin Report. Switzerland: universal …
desiebenthal.blogspot.com/2013/…/the-rubin-report-switzerland-basic.ht…16 oct. 2013 – The new money is not coming from taxes or salaries but from the money creation actually given to the bankers by billions or even quadrillions.
-
François de Siebenthal: Faux lingots au tungstène, folie sur l’or …
desiebenthal.blogspot.com/…/faux-lingots-au-tungstene-folie-sur-lor.htm…31 janv. 2013 – On n’a plus confiance dans les “banques centrales” (New York Fed en fait privée et Banque centrale d’Angleterre), censées détenir l’or …
-
François de Siebenthal: Dr. Martin Luther King Jr. for basic income
desiebenthal.blogspot.com/2013/…/dr-martin-luther-king-jr-for-basic.ht…7 oct. 2013 – “We are demanding an emergency program to provide employment for everyone in need of a job, or if a work program is impractical, …
-
François de Siebenthal: Rappel de fraudes démocratiques à …
desiebenthal.blogspot.com/…/rappel-de-fraudes-democratiques-lausanne….31 oct. 2013 – Or, vu notre recours lors du premier tour pour fraudes électorales, une … par vous-même avec Mme Bücher, MM Zutter, Mühl et de Siebenthal.
-
François de Siebenthal: UBI seen from California
desiebenthal.blogspot.com/2013/10/ubi-seen-from-california.html21 oct. 2013 – The new money is not coming from taxes or salaries but from the money creation actually given to the bankers by billions or even quadrillions.
-
François de Siebenthal: Porrentruy, fraudes démocratiques …
desiebenthal.blogspot.com/2013/…/porrentruy-fraudes-democratiques.ht…24 oct. 2013 – Or, l’instruction pénale n’est pas close. Frédérique Comte a encore entendu des «personnes appelées à donner des renseignements» le 29 …
-
François de Siebenthal: Berne, Bedag AG…Fraudes, un rappel des …
desiebenthal.blogspot.com/…/berne-bedag-agfraudes-un-rappel-des.html14 oct. 2013 – Affaires de Bâle, de l’UDC, de l’ONU, de la révision de la constitution, de la vente d’or de la BNS, de la LAMAL…. Les résultats de Lucerne ont …
-
François de Siebenthal: Fraudes démocratiques genevoises …
desiebenthal.blogspot.com/2013/…/fraudes-democratiques-genevoises.ht…6 oct. 2013 – Posted by François de Siebenthal at 13:41:00 … IOR. Catholiques, balayons devant notre porte. septembre (15). août (14). juillet (3). juin (8).
-
François de Siebenthal: Fraudes démocratiques si faciles…
desiebenthal.blogspot.com/2013/10/fraudes-democratiques-si-faciles.html… début de vote par correspondance… Posted by François de Siebenthal at 15:56:00 … IOR. Catholiques, balayons devant notre porte. septembre (15). août (14).
Commentaires récents